| The ONE Group to Acquire Owner of Benihana |
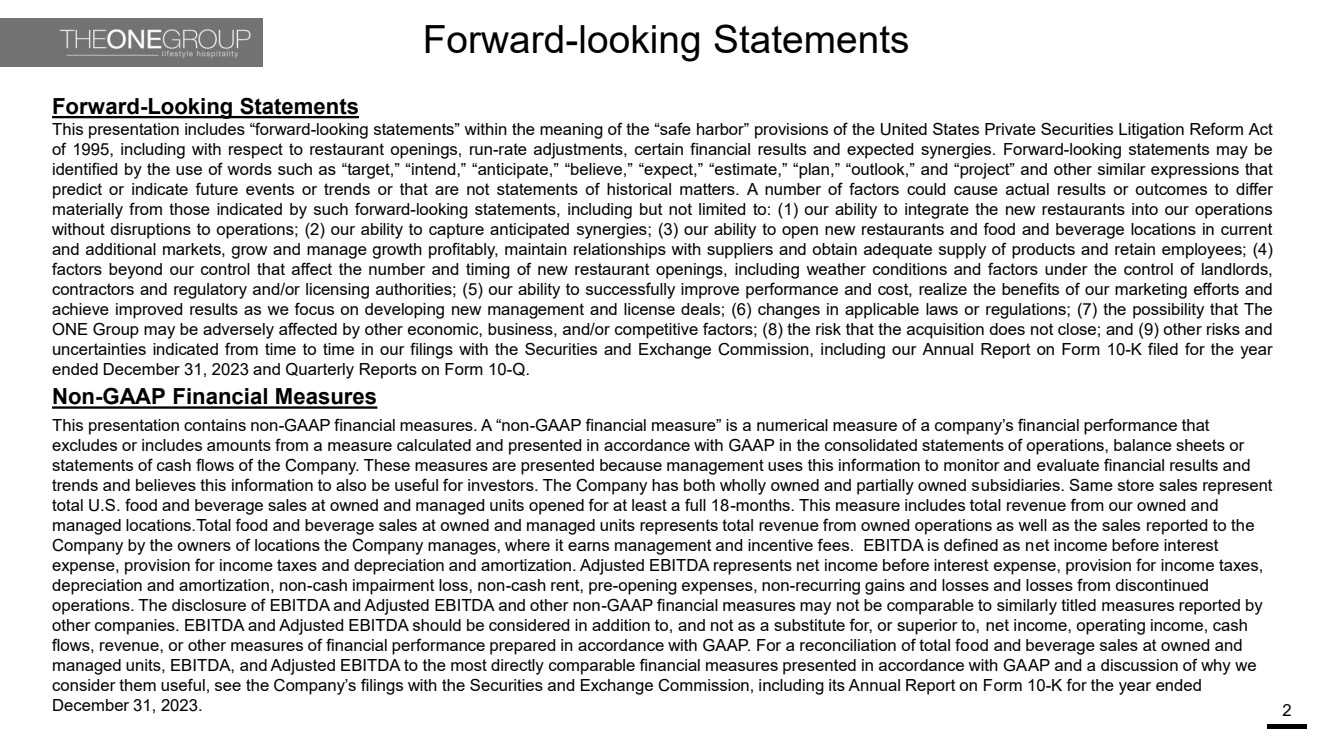
| Forward-looking Statements 2 Forward-Looking Statements This presentation includes “forward-looking statements” within the meaning of the “safe harbor” provisions of the United States Private Securities Litigation Reform Act of 1995, including with respect to restaurant openings, run-rate adjustments, certain financial results and expected synergies. Forward-looking statements may be identified by the use of words such as “target,” “intend,” “anticipate,” “believe,” “expect,” “estimate,” “plan,” “outlook,” and “project” and other similar expressions that predict or indicate future events or trends or that are not statements of historical matters. A number of factors could cause actual results or outcomes to differ materially from those indicated by such forward-looking statements, including but not limited to: (1) our ability to integrate the new restaurants into our operations without disruptions to operations; (2) our ability to capture anticipated synergies; (3) our ability to open new restaurants and food and beverage locations in current and additional markets, grow and manage growth profitably, maintain relationships with suppliers and obtain adequate supply of products and retain employees; (4) factors beyond our control that affect the number and timing of new restaurant openings, including weather conditions and factors under the control of landlords, contractors and regulatory and/or licensing authorities; (5) our ability to successfully improve performance and cost, realize the benefits of our marketing efforts and achieve improved results as we focus on developing new management and license deals; (6) changes in applicable laws or regulations; (7) the possibility that The ONE Group may be adversely affected by other economic, business, and/or competitive factors; (8) the risk that the acquisition does not close; and (9) other risks and uncertainties indicated from time to time in our filings with the Securities and Exchange Commission, including our Annual Report on Form 10-K filed for the year ended December 31, 2023 and Quarterly Reports on Form 10-Q. Non-GAAP Financial Measures This presentation contains non-GAAP financial measures. A “non-GAAP financial measure” is a numerical measure of a company’s financial performance that excludes or includes amounts from a measure calculated and presented in accordance with GAAP in the consolidated statements of operations, balance sheets or statements of cash flows of the Company. These measures are presented because management uses this information to monitor and evaluate financial results and trends and believes this information to also be useful for investors. The Company has both wholly owned and partially owned subsidiaries. Same store sales represent total U.S. food and beverage sales at owned and managed units opened for at least a full 18-months. This measure includes total revenue from our owned and managed locations.Total food and beverage sales at owned and managed units represents total revenue from owned operations as well as the sales reported to the Company by the owners of locations the Company manages, where it earns management and incentive fees. EBITDA is defined as net income before interest expense, provision for income taxes and depreciation and amortization. Adjusted EBITDA represents net income before interest expense, provision for income taxes, depreciation and amortization, non-cash impairment loss, non-cash rent, pre-opening expenses, non-recurring gains and losses and losses from discontinued operations. The disclosure of EBITDA and Adjusted EBITDA and other non-GAAP financial measures may not be comparable to similarly titled measures reported by other companies. EBITDA and Adjusted EBITDA should be considered in addition to, and not as a substitute for, or superior to, net income, operating income, cash flows, revenue, or other measures of financial performance prepared in accordance with GAAP. For a reconciliation of total food and beverage sales at owned and managed units, EBITDA, and Adjusted EBITDA to the most directly comparable financial measures presented in accordance with GAAP and a discussion of why we consider them useful, see the Company’s filings with the Securities and Exchange Commission, including its Annual Report on Form 10-K for the year ended December 31, 2023. |
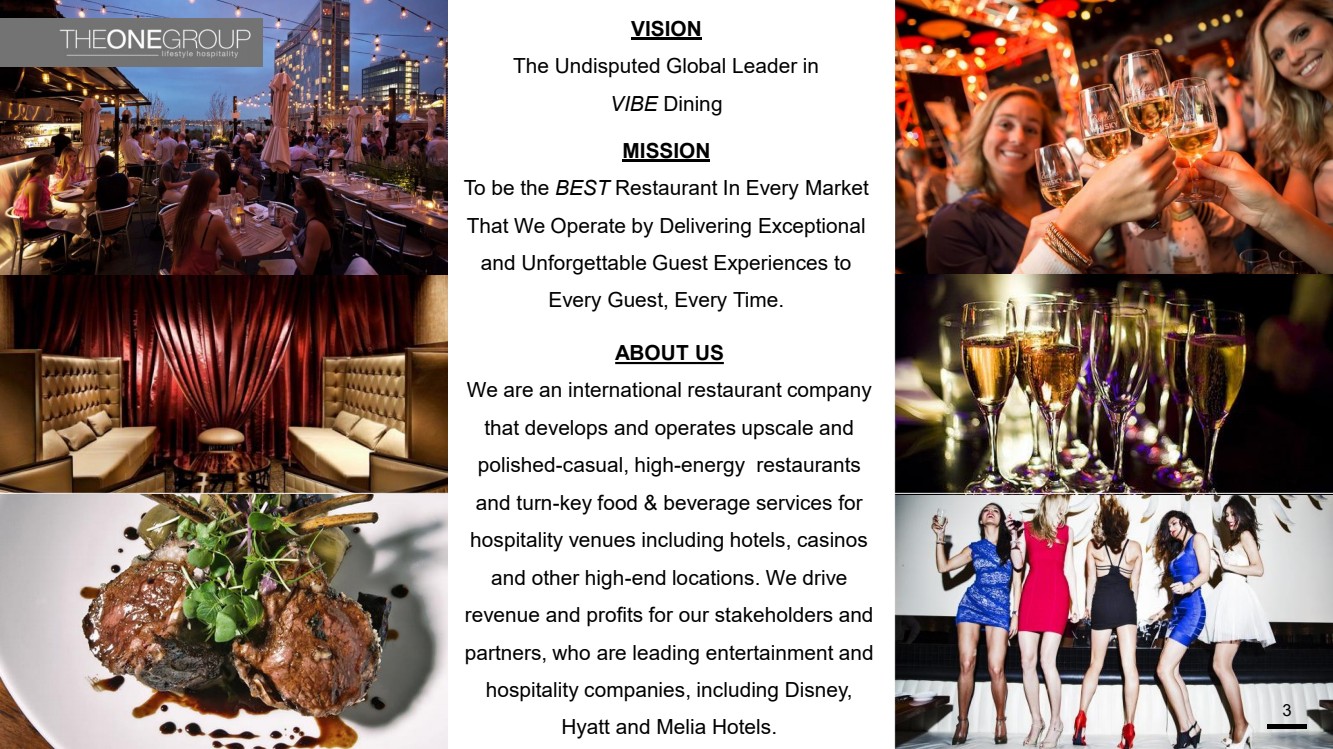
| 3 VISION The Undisputed Global Leader in VIBE Dining ABOUT US We are an international restaurant company that develops and operates upscale and polished -casual, high -energy restaurants and turn -key food & beverage services for hospitality venues including hotels, casinos and other high -end locations. We drive revenue and profits for our stakeholders and partners, who are leading entertainment and hospitality companies, including Disney, Hyatt and Melia Hotels. MISSION To be the BEST Restaurant In Every Market That We Operate by Delivering Exceptional and Unforgettable Guest Experiences to Every Guest, Every Time. |
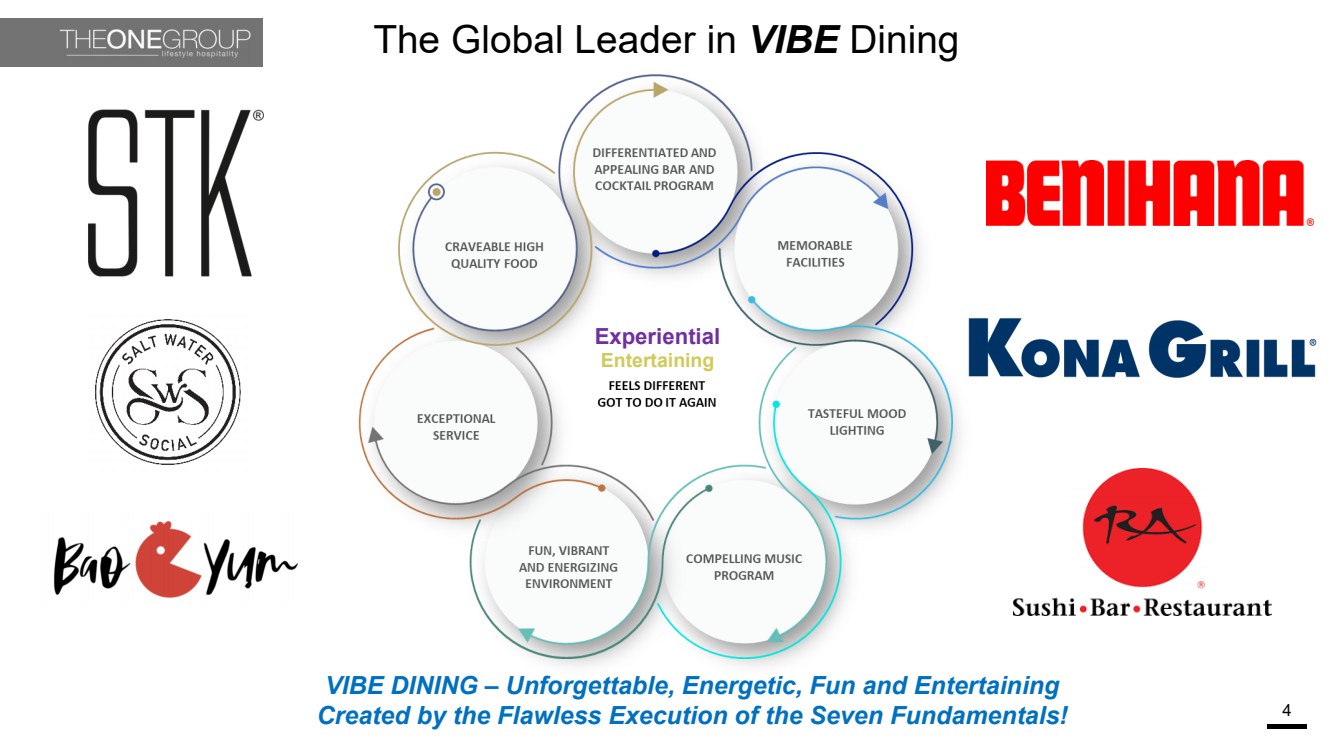
| Experiential Entertaining The Global Leader in VIBE Dining 4 VIBE DINING – Unforgettable, Energetic, Fun and Entertaining Created by the Flawless Execution of the Seven Fundamentals! |
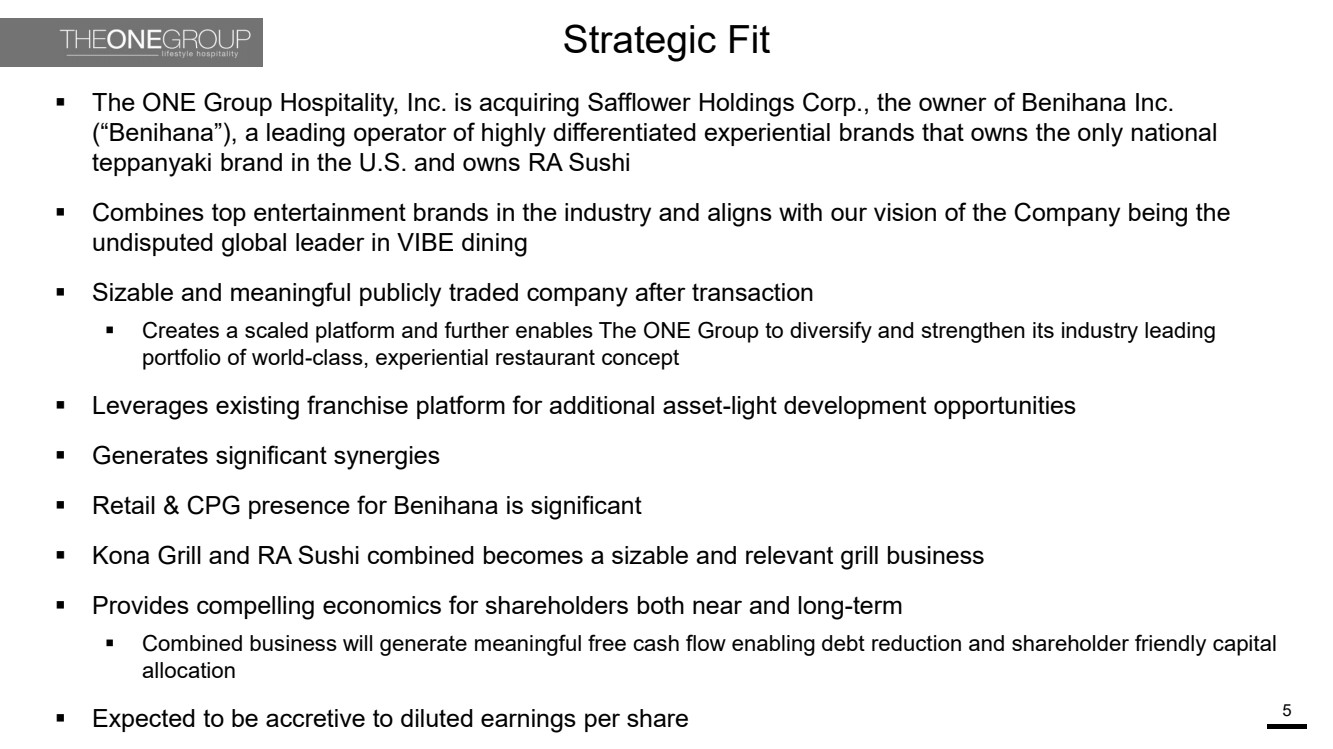
| Strategic Fit 5 ▪ The ONE Group Hospitality, Inc. is acquiring Safflower Holdings Corp., the owner of Benihana Inc. (“Benihana”), a leading operator of highly differentiated experiential brands that owns the only national teppanyaki brand in the U.S. and owns RA Sushi ▪ Combines top entertainment brands in the industry and aligns with our vision of the Company being the undisputed global leader in VIBE dining ▪ Sizable and meaningful publicly traded company after transaction ▪ Creates a scaled platform and further enables The ONE Group to diversify and strengthen its industry leading portfolio of world-class, experiential restaurant concept ▪ Leverages existing franchise platform for additional asset-light development opportunities ▪ Generates significant synergies ▪ Retail & CPG presence for Benihana is significant ▪ Kona Grill and RA Sushi combined becomes a sizable and relevant grill business ▪ Provides compelling economics for shareholders both near and long-term ▪ Combined business will generate meaningful free cash flow enabling debt reduction and shareholder friendly capital allocation ▪ Expected to be accretive to diluted earnings per share |
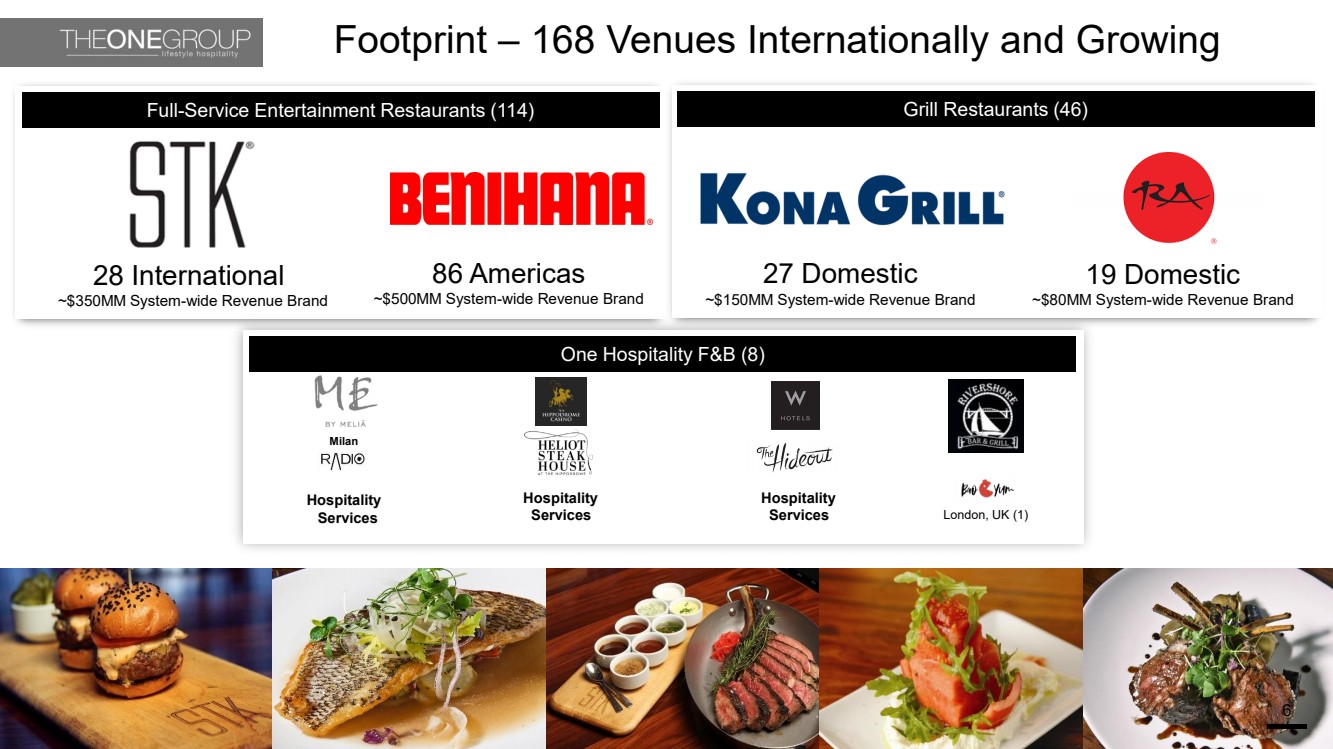
| Footprint – 168 Venues Internationally and Growing 6 Full-Service Entertainment Restaurants (114) Grill Restaurants (46) One Hospitality F&B (8) Hospitality Services Hospitality Services Milan Radio Hospitality Services London, UK (1) 27 Domestic ~$150MM System-wide Revenue Brand 19 Domestic ~$80MM System-wide Revenue Brand 28 International ~$350MM System-wide Revenue Brand 86 Americas ~$500MM System-wide Revenue Brand |
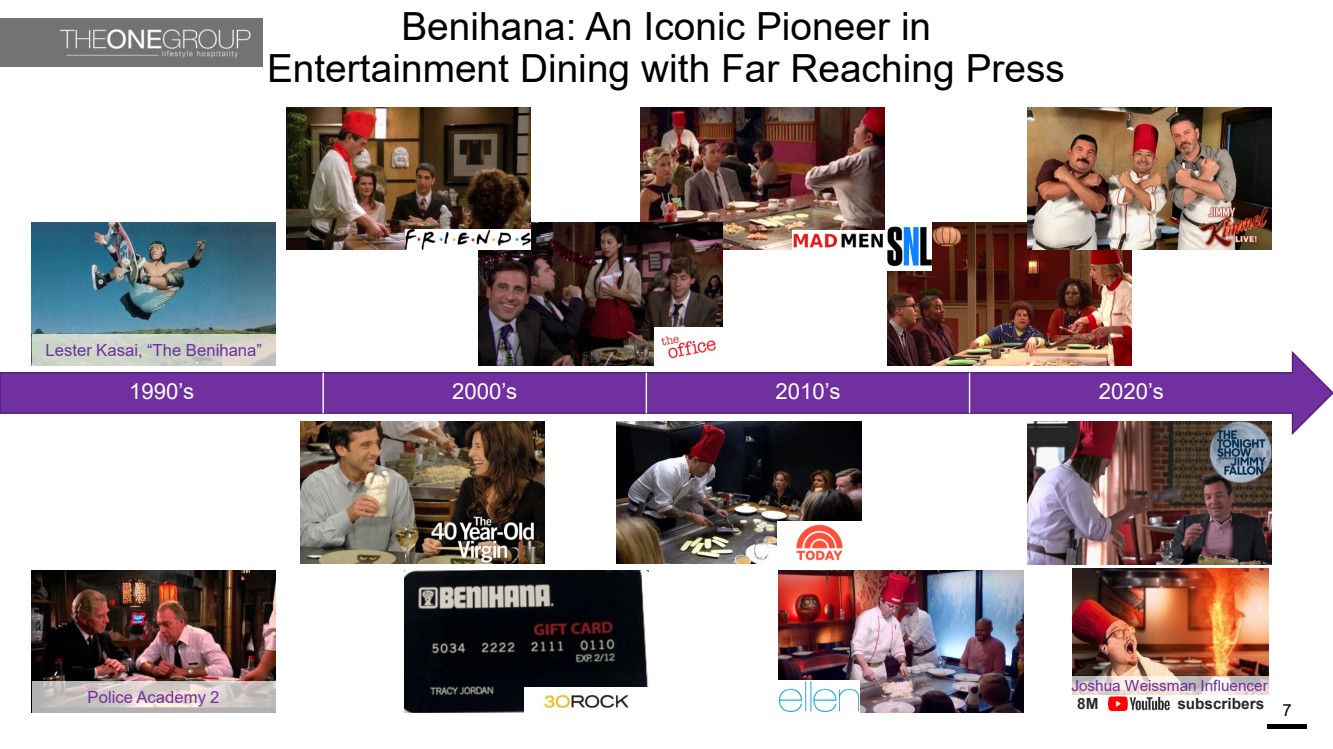
| Benihana: An Iconic Pioneer in Entertainment Dining with Far Reaching Press 7 Lester Kasai, “The Benihana” Police Academy 2 1990’s 2000’s 2010’s 2020’s Joshua Weissman Influencer 8M subscribers 8M subscribers |
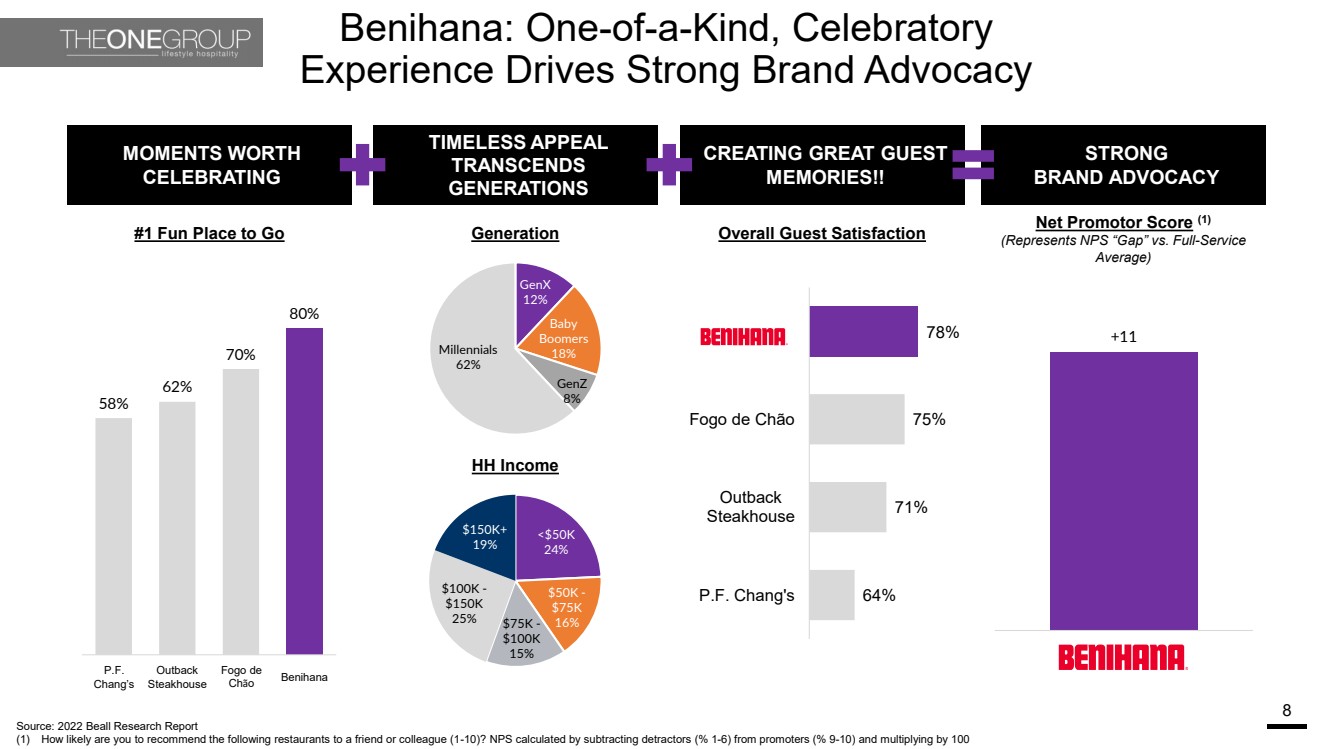
| Benihana: One-of-a-Kind, Celebratory Experience Drives Strong Brand Advocacy 8 58% 62% 70% 80% +11 MOMENTS WORTH CELEBRATING STRONG BRAND ADVOCACY TIMELESS APPEAL TRANSCENDS GENERATIONS Net Promotor Score (1) (Represents NPS “Gap” vs. Full-Service Average) GenX 12% Baby Boomers 18% GenZ 8% Millennials 62% Generation HH Income <$50K 24% $50K - $75K $75K - 16% $100K 15% $100K - $150K 25% $150K+ 19% #1 Fun Place to Go Benihana Fogo de Chão P.F. Chang’s Outback Steakhouse CREATING GREAT GUEST MEMORIES!! 78% 75% 71% 64% Fogo de Chão Outback Steakhouse P.F. Chang's Overall Guest Satisfaction Source: 2022 Beall Research Report (1) How likely are you to recommend the following restaurants to a friend or colleague (1-10)? NPS calculated by subtracting detractors (% 1-6) from promoters (% 9-10) and multiplying by 100 |
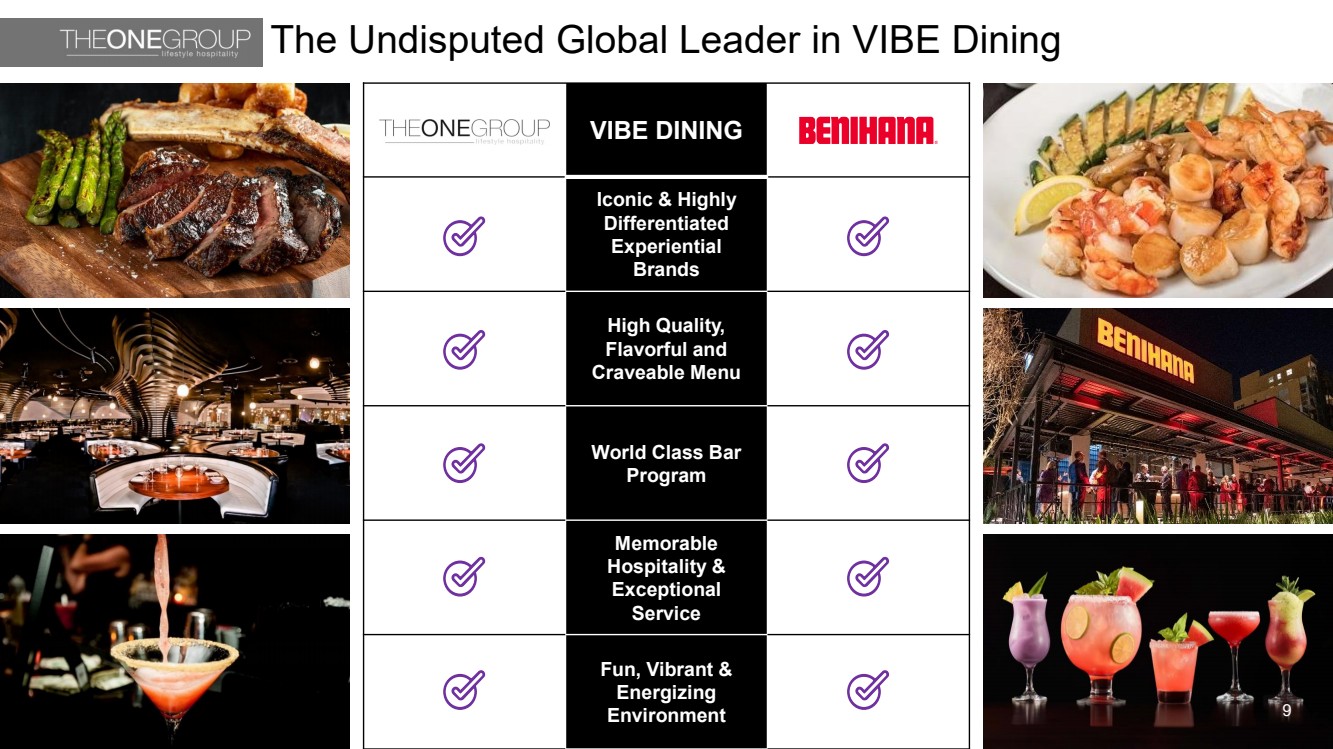
| The Undisputed Global Leader in VIBE Dining VIBE DINING Iconic & Highly Differentiated Experiential Brands High Quality, Flavorful and Craveable Menu World Class Bar Program Memorable Hospitality & Exceptional Service Fun, Vibrant & Energizing Environment 9 |
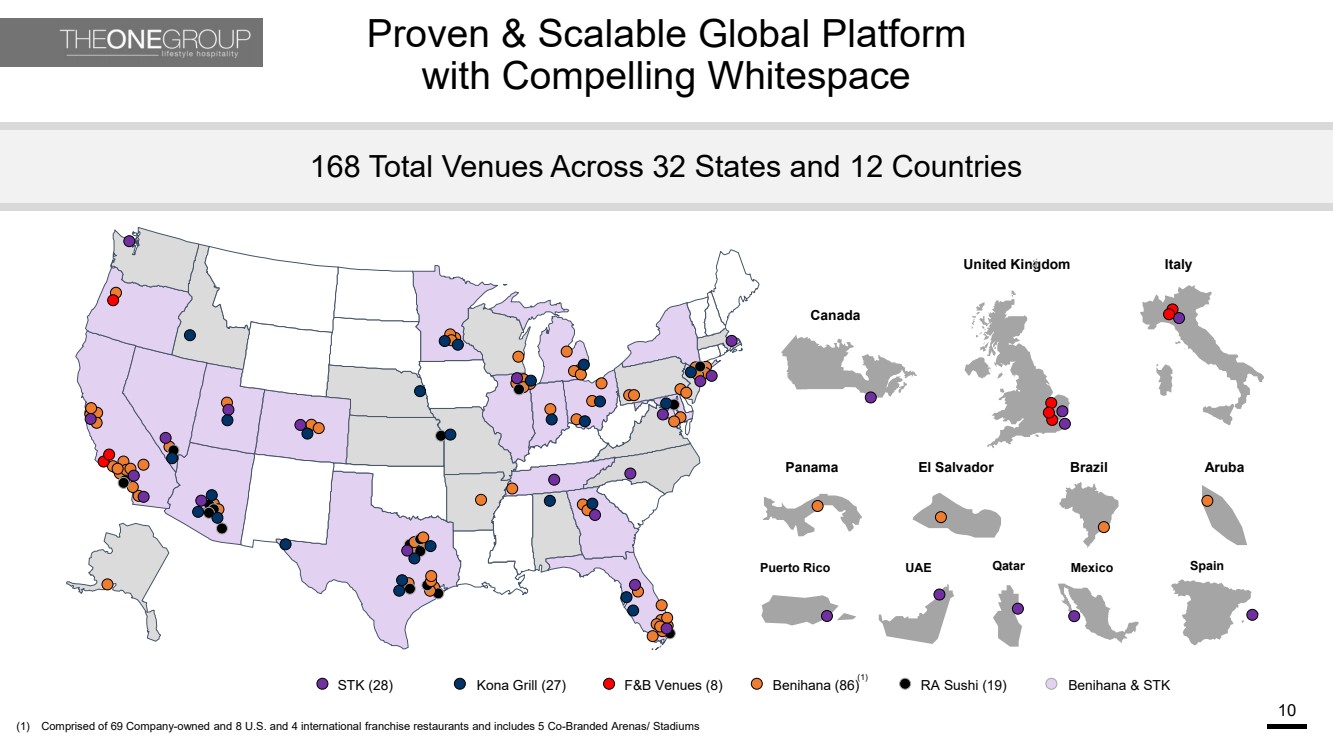
| United Kingdom Proven & Scalable Global Platform with Compelling Whitespace (1) Comprised of 69 Company-owned and 8 U.S. and 4 international franchise restaurants and includes 5 Co-Branded Arenas/ Stadiums 10 168 Total Venues Across 32 States and 12 Countries Puerto Rico UAE Qatar Mexico Spain Italy Canada Panama El Salvador Brazil Aruba STK (28) Kona Grill (27) F&B Venues (8) Benihana (86) RA Sushi (19) Benihana & STK (1) |
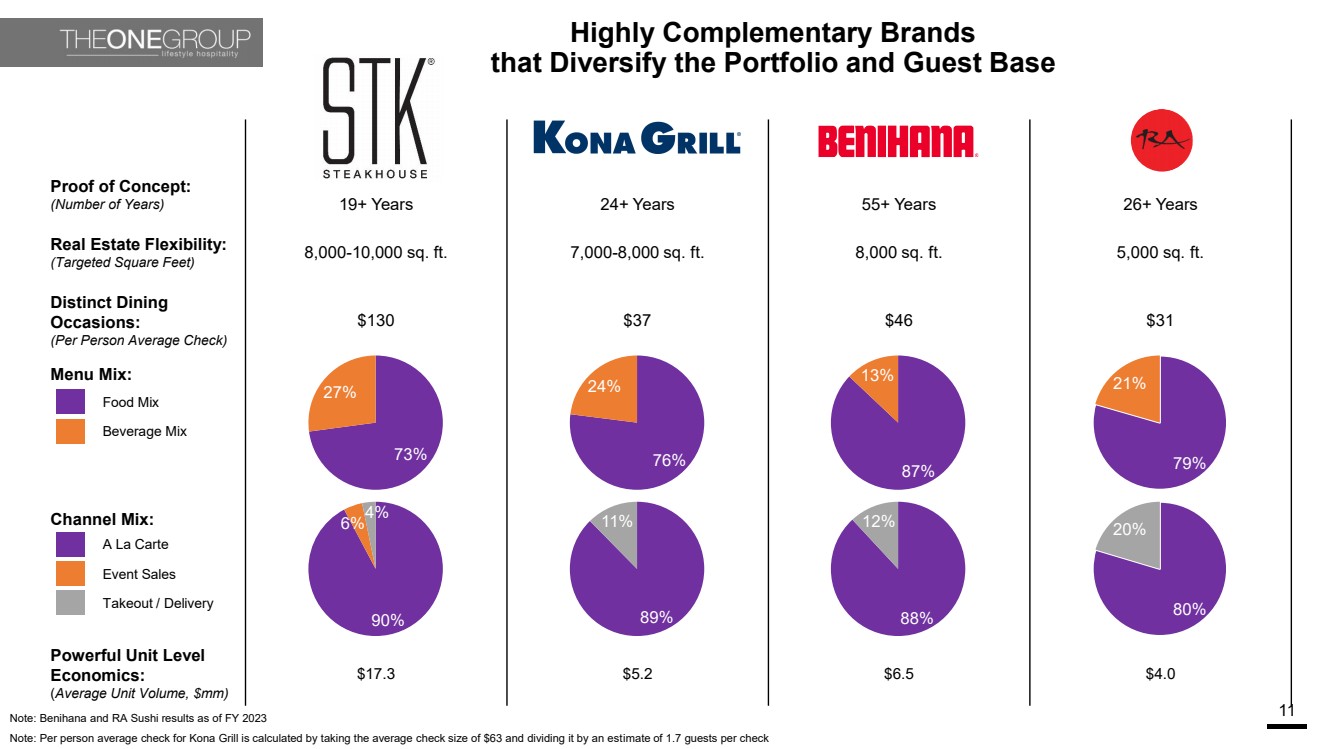
| Proof of Concept: (Number of Years) 19+ Years 24+ Years 55+ Years 26+ Years Real Estate Flexibility: (Targeted Square Feet) 8,000-10,000 sq. ft. 7,000-8,000 sq. ft. 8,000 sq. ft. 5,000 sq. ft. Distinct Dining Occasions: (Per Person Average Check) $130 $37 $46 $31 Menu Mix: Channel Mix: Powerful Unit Level Economics: (Average Unit Volume, $mm) $17.3 $5.2 $6.5 $4.0 Highly Complementary Brands that Diversify the Portfolio and Guest Base 11 73% 27% 76% 24% Food Mix Beverage Mix A La Carte Event Sales Takeout / Delivery 90% 6%4% 89% 11% 87% 13% 88% 12% 79% 21% 80% 20% Note: Benihana and RA Sushi results as of FY 2023 Note: Per person average check for Kona Grill is calculated by taking the average check size of $63 and dividing it by an estimate of 1.7 guests per check |
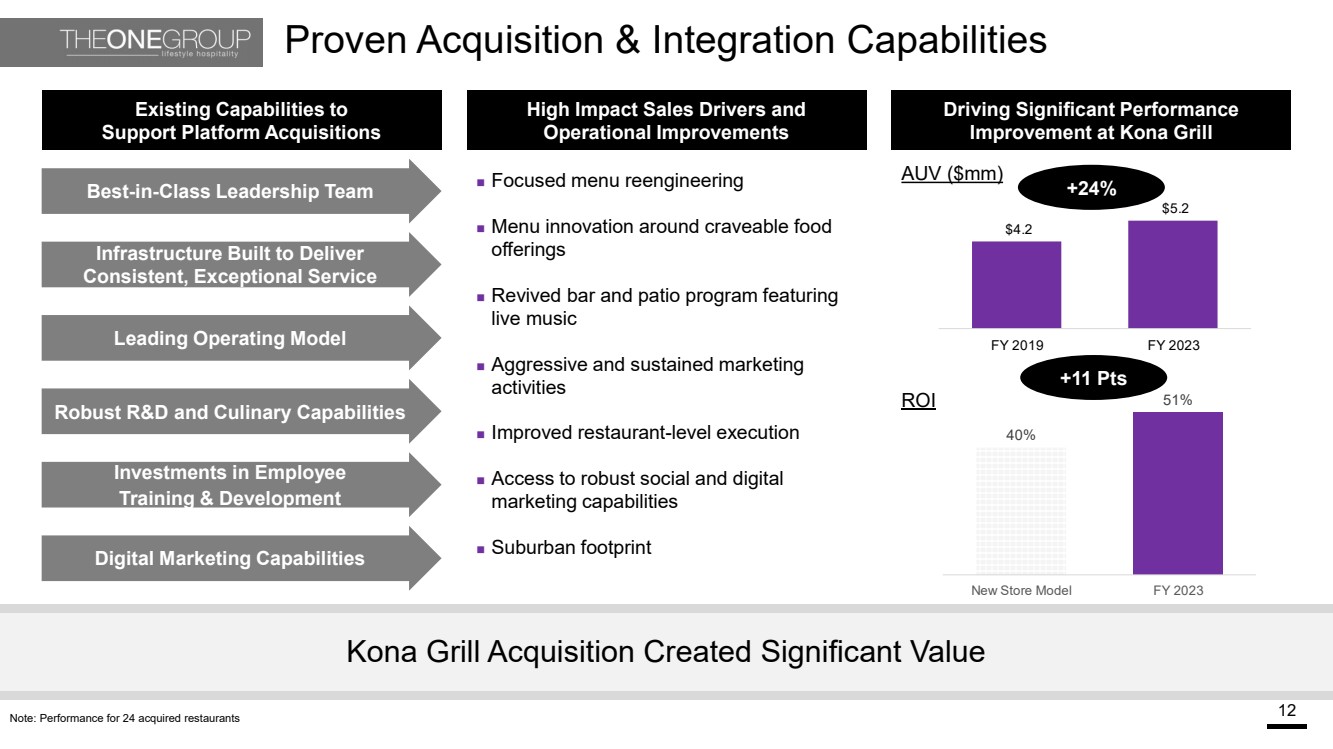
| Proven Acquisition & Integration Capabilities 12 Existing Capabilities to Support Platform Acquisitions Best-in-Class Leadership Team Robust R&D and Culinary Capabilities Investments in Employee Training & Development Leading Operating Model Infrastructure Built to Deliver Consistent, Exceptional Service Kona Grill Acquisition Created Significant Value Digital Marketing Capabilities High Impact Sales Drivers and Operational Improvements Driving Significant Performance Improvement at Kona Grill ◼ Focused menu reengineering ◼ Menu innovation around craveable food offerings ◼ Revived bar and patio program featuring live music ◼ Aggressive and sustained marketing activities ◼ Improved restaurant-level execution ◼ Access to robust social and digital marketing capabilities ◼ Suburban footprint AUV ($mm) +24% ROI +11 Pts Note: Performance for 24 acquired restaurants |
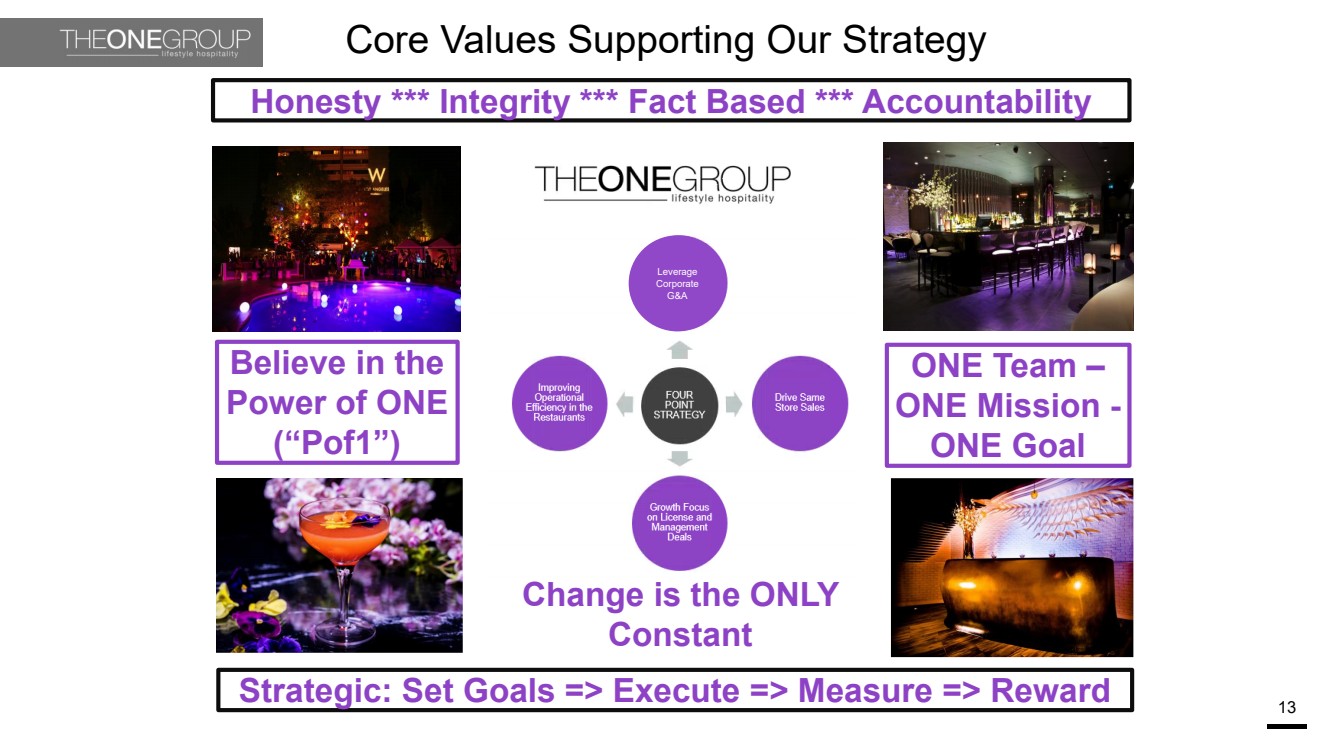
| Core Values Supporting Our Strategy Strategic: Set Goals => Execute => Measure => Reward 13 Believe in the Power of ONE (“Pof1”) ONE Team – ONE Mission - ONE Goal Honesty *** Integrity *** Fact Based *** Accountability 37 Change is the ONLY Constant Leverage Corporate G&A |
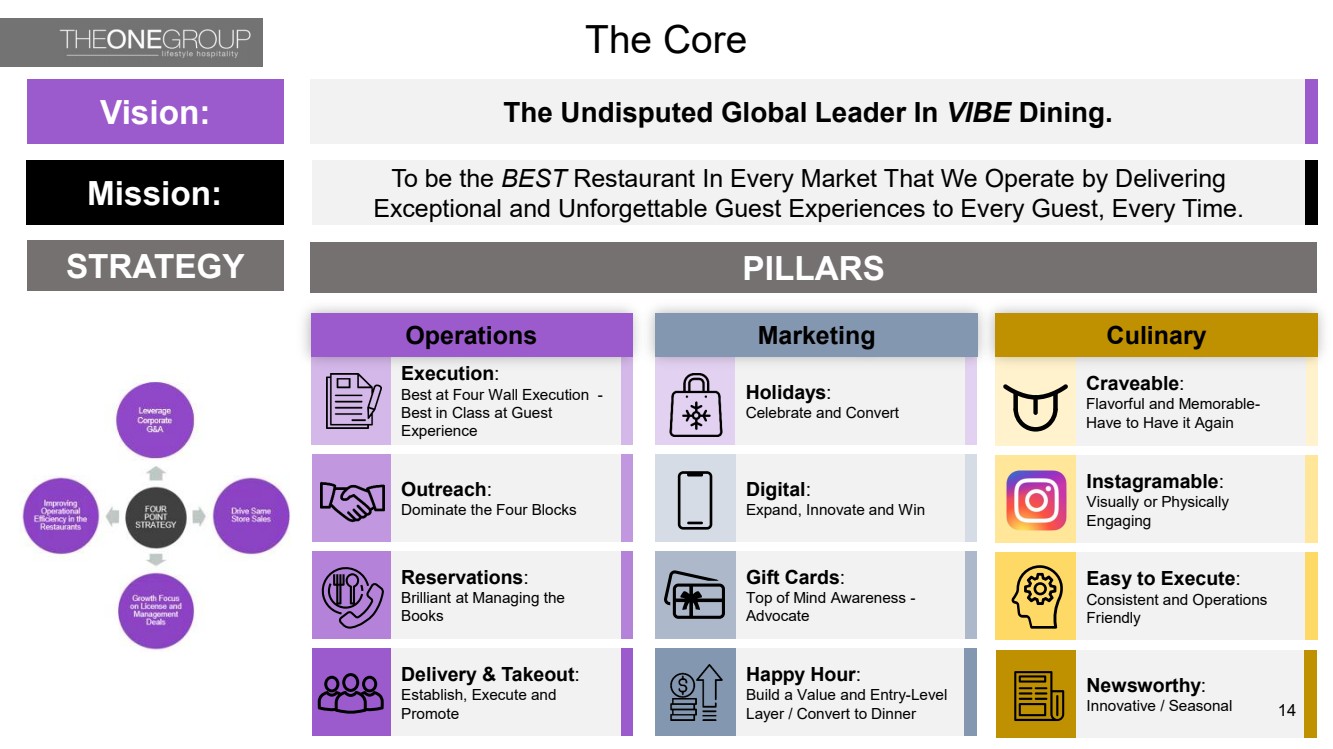
| Execution: Best at Four Wall Execution - Best in Class at Guest Experience Reservations: Brilliant at Managing the Books Delivery & Takeout: Establish, Execute and Promote Outreach: Dominate the Four Blocks Holidays: Celebrate and Convert Gift Cards: Top of Mind Awareness - Advocate Happy Hour: Build a Value and Entry-Level Layer / Convert to Dinner Digital: Expand, Innovate and Win Craveable: Flavorful and Memorable-Have to Have it Again Easy to Execute: Consistent and Operations Friendly Newsworthy: Innovative / Seasonal Instagramable: Visually or Physically Engaging STRATEGY PILLARS Vision: The Undisputed Global Leader In VIBE Dining. Mission: To be the BEST Restaurant In Every Market That We Operate by Delivering Exceptional and Unforgettable Guest Experiences to Every Guest, Every Time. Operations Marketing Culinary 14 The Core |
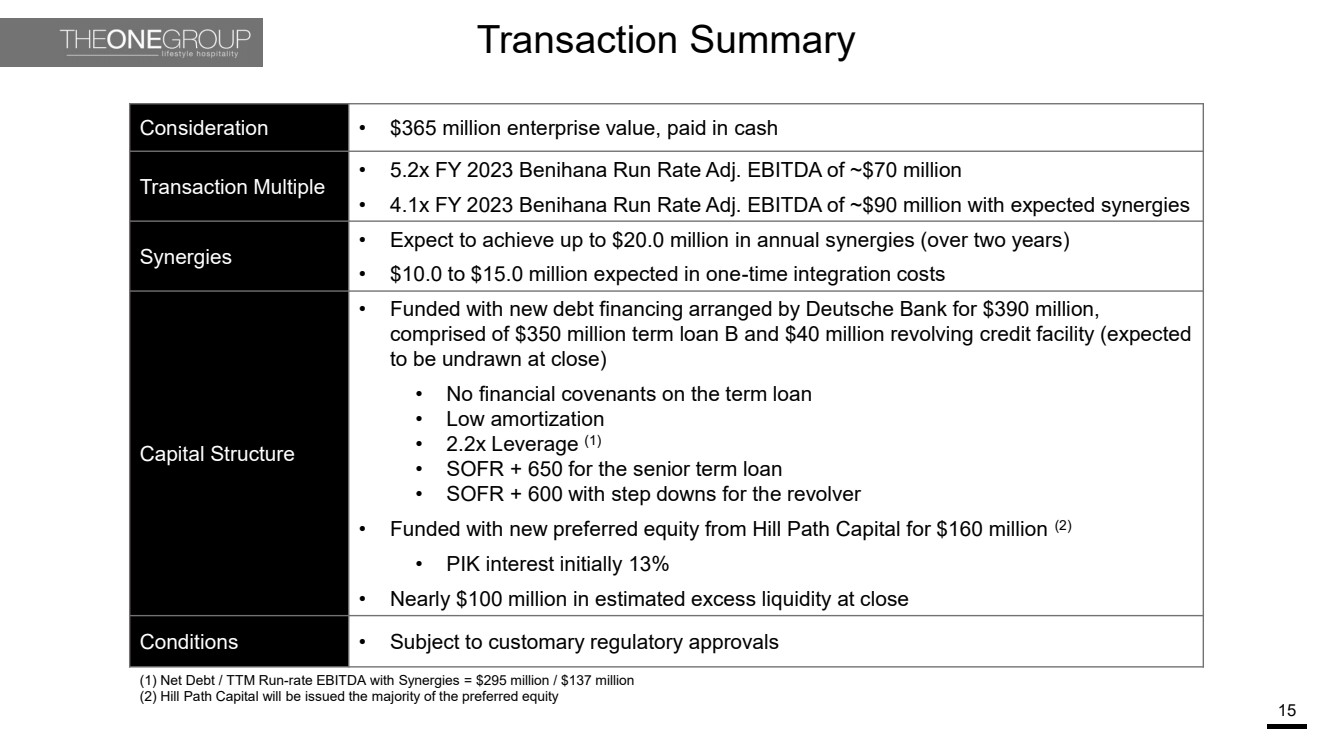
| Transaction Summary 15 Consideration • $365 million enterprise value, paid in cash Transaction Multiple • 5.2x FY 2023 Benihana Run Rate Adj. EBITDA of ~$70 million • 4.1x FY 2023 Benihana Run Rate Adj. EBITDA of ~$90 million with expected synergies Synergies • Expect to achieve up to $20.0 million in annual synergies (over two years) • $10.0 to $15.0 million expected in one-time integration costs Capital Structure • Funded with new debt financing arranged by Deutsche Bank for $390 million, comprised of $350 million term loan B and $40 million revolving credit facility (expected to be undrawn at close) • No financial covenants on the term loan • Low amortization • 2.2x Leverage (1) • SOFR + 650 for the senior term loan • SOFR + 600 with step downs for the revolver • Funded with new preferred equity from Hill Path Capital for $160 million (2) • PIK interest initially 13% • Nearly $100 million in estimated excess liquidity at close Conditions • Subject to customary regulatory approvals (1) Net Debt / TTM Run-rate EBITDA with Synergies = $295 million / $137 million (2) Hill Path Capital will be issued the majority of the preferred equity |
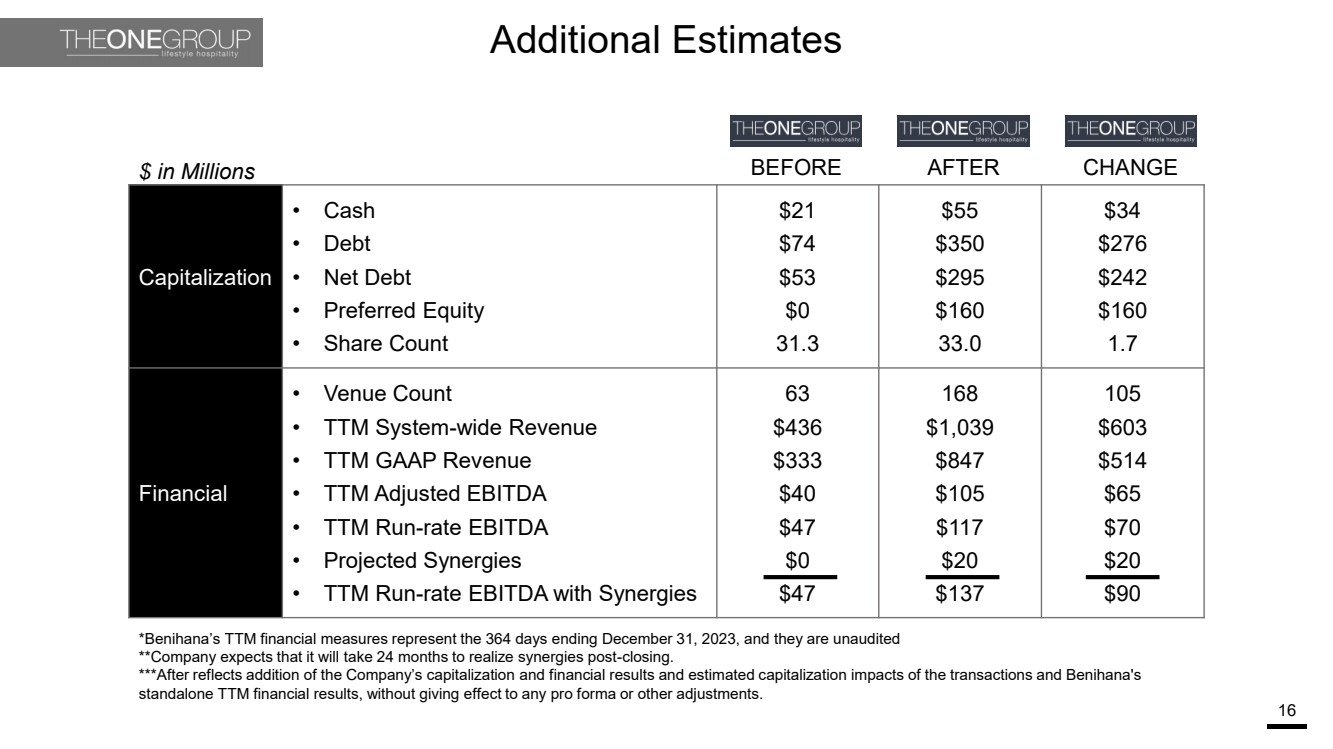
| Additional Estimates 16 Capitalization • Cash • Debt • Net Debt • Preferred Equity • Share Count $21 $74 $53 $0 31.3 $55 $350 $295 $160 33.0 $34 $276 $242 $160 1.7 Financial • Venue Count • TTM System-wide Revenue • TTM GAAP Revenue • TTM Adjusted EBITDA • TTM Run-rate EBITDA • Projected Synergies • TTM Run-rate EBITDA with Synergies 63 $436 $333 $40 $47 $0 $47 168 $1,039 $847 $105 $117 $20 $137 105 $603 $514 $65 $70 $20 $90 $ in Millions BEFORE AFTER CHANGE *Benihana’s TTM financial measures represent the 364 days ending December 31, 2023, and they are unaudited **Company expects that it will take 24 months to realize synergies post-closing. ***After reflects addition of h C mpany’s capi a iza i n and financial results and estimated capitalization impacts of the transactions and Benihana's standalone TTM financial results, without giving effect to any pro forma or other adjustments. |
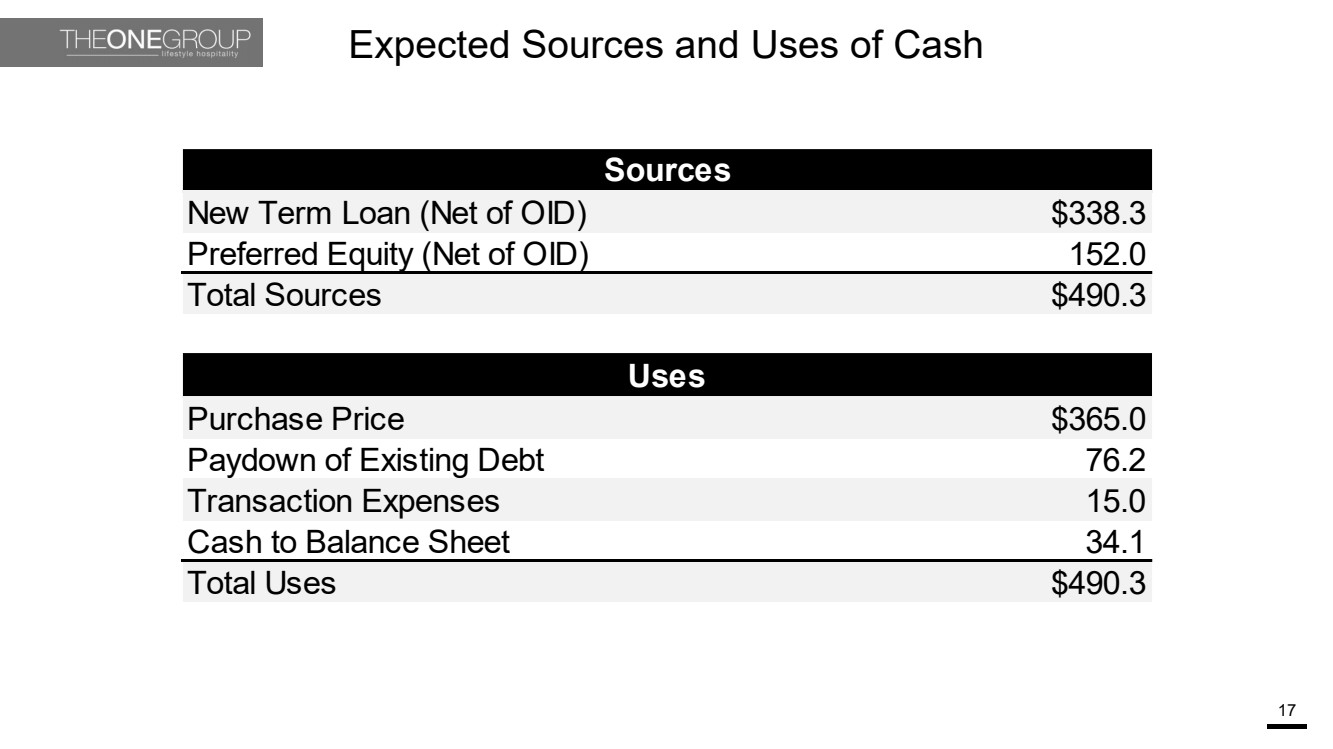
| Expected Sources and Uses of Cash 17 New Term Loan (Net of OID) $338.3 Preferred Equity (Net of OID) 152.0 Total Sources $490.3 Purchase Price $365.0 Paydown of Existing Debt 76.2 Transaction Expenses 15.0 Cash to Balance Sheet 34.1 Total Uses $490.3 Sources Uses |
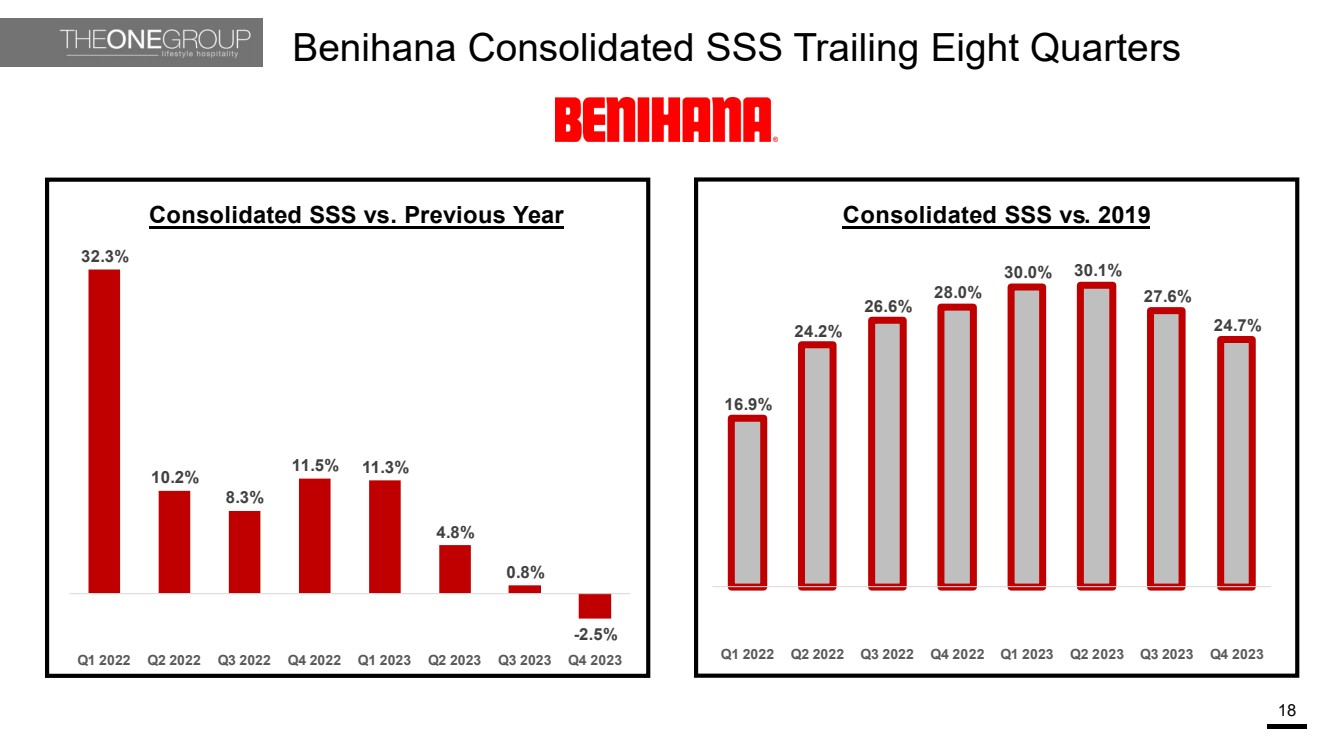
| Benihana Consolidated SSS Trailing Eight Quarters 18 |
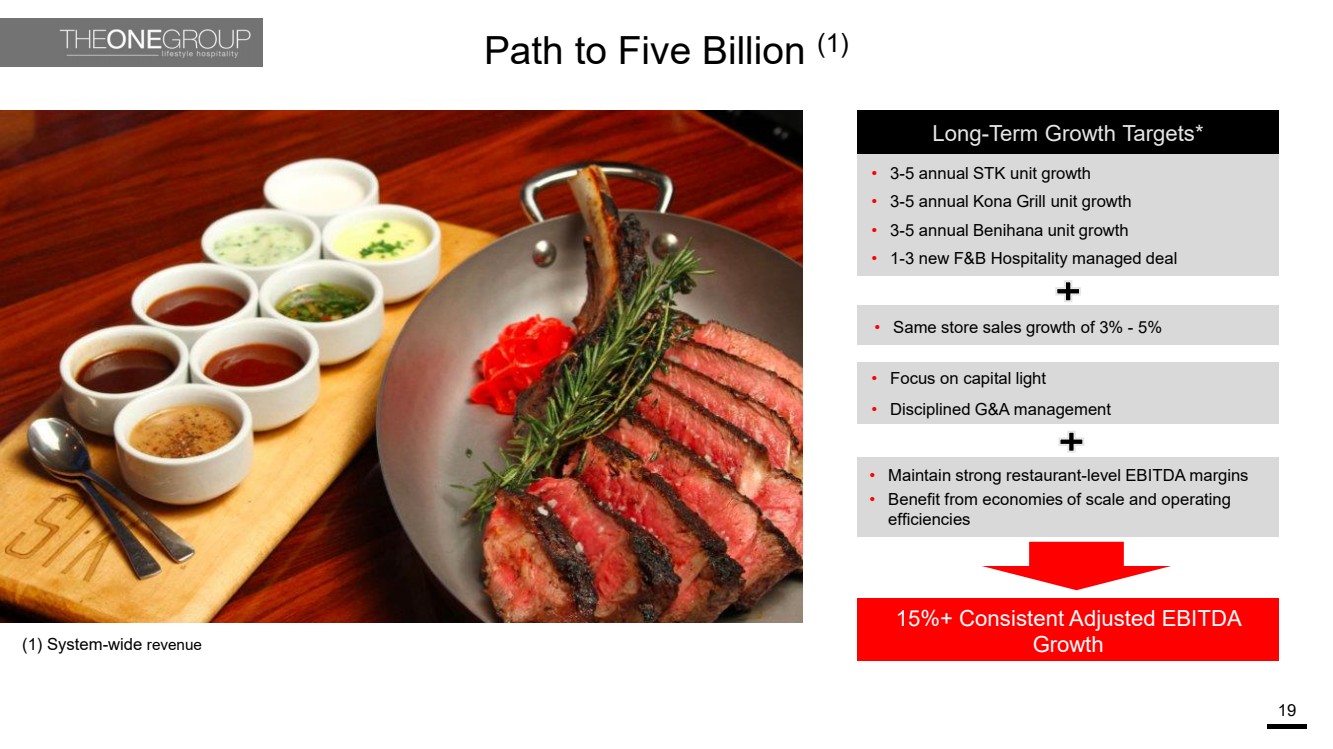
| Path to Five Billion (1) 19 • 3-5 annual STK unit growth • 3-5 annual Kona Grill unit growth • 3-5 annual Benihana unit growth • 1-3 new F&B Hospitality managed deal 15%+ Consistent Adjusted EBITDA Growth Long-Term Growth Targets* • Same store sales growth of 3% - 5% • Maintain strong restaurant-level EBITDA margins • Benefit from economies of scale and operating efficiencies • Focus on capital light • Disciplined G&A management (1) System-wide revenue |
| The ONE Group Highlights 20 Fast Growing Hospitality Company Strong Management Team and Infrastructure to Support Growth Multiple Levers to Drive Revenues and Profitability Significant Pipeline for Unit Growth in 2024 and Beyond Strong Portfolio of High Volume, High Margin Brands with Industry Leading ROIC Acquisitions can Further Enhance our Brand Portfolio and Unit Pipeline Well Positioned for Significant Growth in a Transforming Hospitality Sector Share Buybacks Creating Value For Shareholders Strong Economics Drives Flexibility |
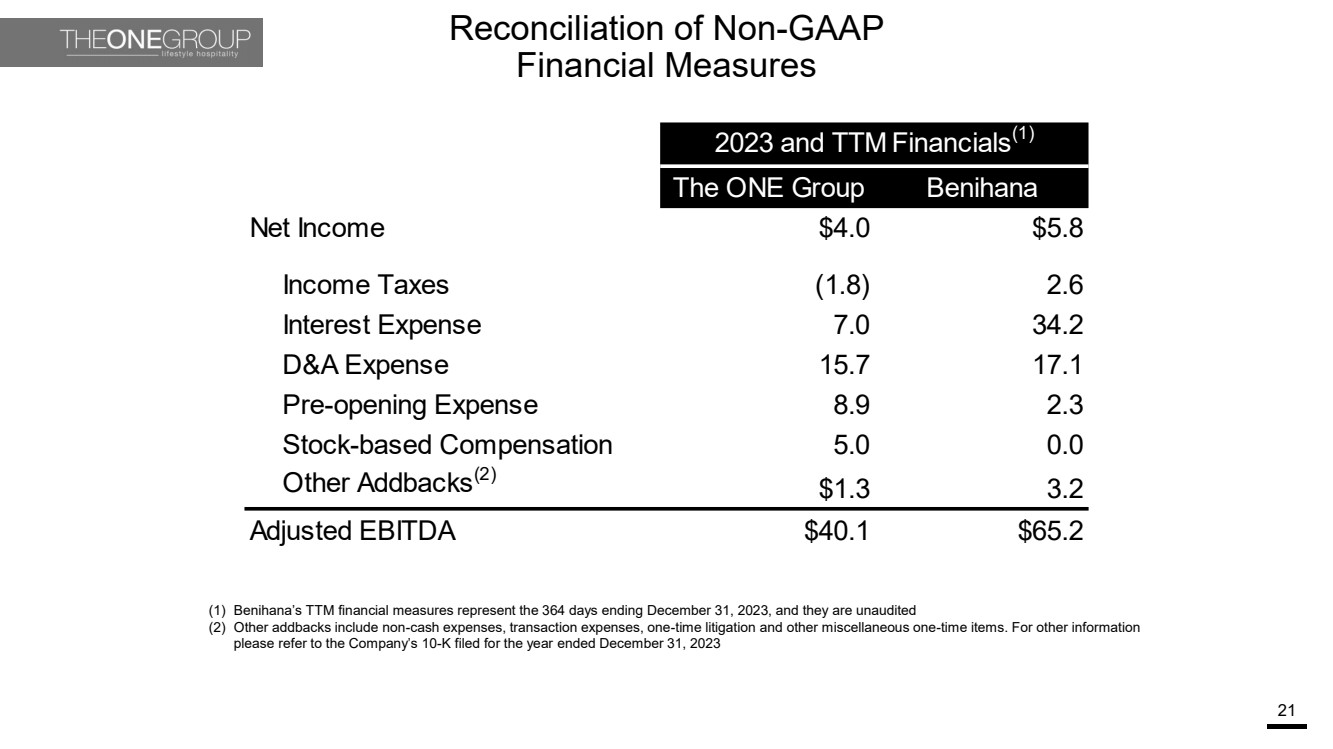
| Reconciliation of Non-GAAP Financial Measures 21 (1) Benihana’s TTM financial measures represent the 364 days ending December 31, 2023, and they are unaudited (2) Other addbacks include non-cash expenses, transaction expenses, one-time litigation and other miscellaneous one-time items. For other information please refer to the Company’s 10-K filed for the year ended December 31, 2023 The ONE Group Benihana Net Income $4.0 $5.8 Income Taxes (1.8) 2.6 Interest Expense 7.0 34.2 D&A Expense 15.7 17.1 Pre-opening Expense 8.9 2.3 Stock-based Compensation 5.0 0.0 Other Addbacks(2) $1.3 3.2 Adjusted EBITDA $40.1 $65.2 2023 and TTM Financials(1) |