Exhibit 99.1
INVESTOR PRESENTATION DECEMBER 2017
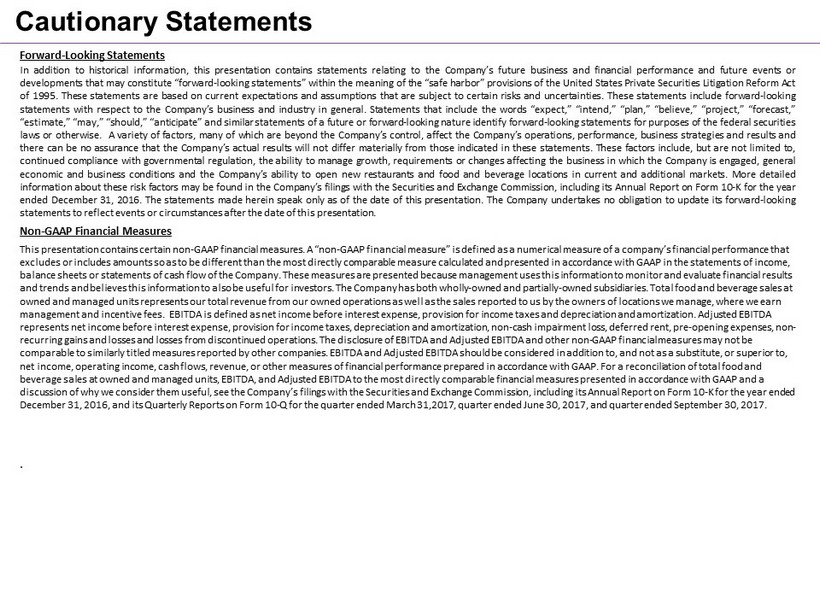
Forward - Looking Statements In addition to historical information, this presentation contains statements relating to the Company’s future business and financial performance and future events or developments that may constitute “forward - looking statements” within the meaning of the “safe harbor” provisions of the United States Private Securities Litigation Reform Act of 1995 . These statements are based on current expectations and assumptions that are subject to certain risks and uncertainties . These statements include forward - looking statements with respect to the Company’s business and industry in general . Statements that include the words “expect,” “intend,” “plan,” “believe,” “project,” “forecast,” “estimate,” “may,” “should,” “anticipate” and similar statements of a future or forward - looking nature identify forward - looking statements for purposes of the federal securities laws or otherwise . A variety of factors, many of which are beyond the Company’s control, affect the Company’s operations, performance, business strategies and results and there can be no assurance that the Company’s actual results will not differ materially from those indicated in these statements . These factors include, but are not limited to, continued compliance with governmental regulation, the ability to manage growth, requirements or changes affecting the business in which the Company is engaged, general economic and business conditions and the Company’s ability to open new restaurants and food and beverage locations in current and additional markets . More detailed information about these risk factors may be found in the Company’s filings with the Securities and Exchange Commission, including its Annual Report on Form 10 - K for the year ended December 31 , 2016 . The statements made herein speak only as of the date of this presentation . The Company undertakes no obligation to update its forward - looking statements to reflect events or circumstances after the date of this presentation . Non - GAAP Financial Measures This presentation contains certain non - GAAP financial measures. A “non - GAAP financial measure” is defined as a numerical measure of a company’s financial performance that excludes or includes amounts so as to be different than the most directly comparable measure calculated and presented in acco rda nce with GAAP in the statements of income, balance sheets or statements of cash flow of the Company. These measures are presented because management uses this informati on to monitor and evaluate financial results and trends and believes this information to also be useful for investors. The Company has both wholly - owned and partially - owned subsidiaries. Total food and beverage sales at owned and managed units represents our total revenue from our owned operations as well as the sales reported to us by the own ers of locations we manage, where we earn management and incentive fees. EBITDA is defined as net income before interest expense, provision for income taxes and depre cia tion and amortization. Adjusted EBITDA represents net income before interest expense, provision for income taxes, depreciation and amortization, non - cash impairment lo ss, deferred rent, pre - opening expenses, non - recurring gains and losses and losses from discontinued operations. The disclosure of EBITDA and Adjusted EBITDA and other non - GAAP financial measures may not be comparable to similarly titled measures reported by other companies. EBITDA and Adjusted EBITDA should be considered in addit ion to, and not as a substitute, or superior to, net income, operating income, cash flows, revenue, or other measures of financial performance prepared in accordance with GAA P. For a reconciliation of total food and beverage sales at owned and managed units, EBITDA, and Adjusted EBITDA to the most directly comparable financial measures pre sen ted in accordance with GAAP and a discussion of why we consider them useful, see the Company’s filings with the Securities and Exchange Commission, including its Annual Report on Form 10 - K for the year ended December 31, 2016, and its Quarterly Reports on Form 10 - Q for the quarter ended March 31,2017, quarter ended June 30, 2017, and quarter ended September 30, 2017. . Cautionary Statements

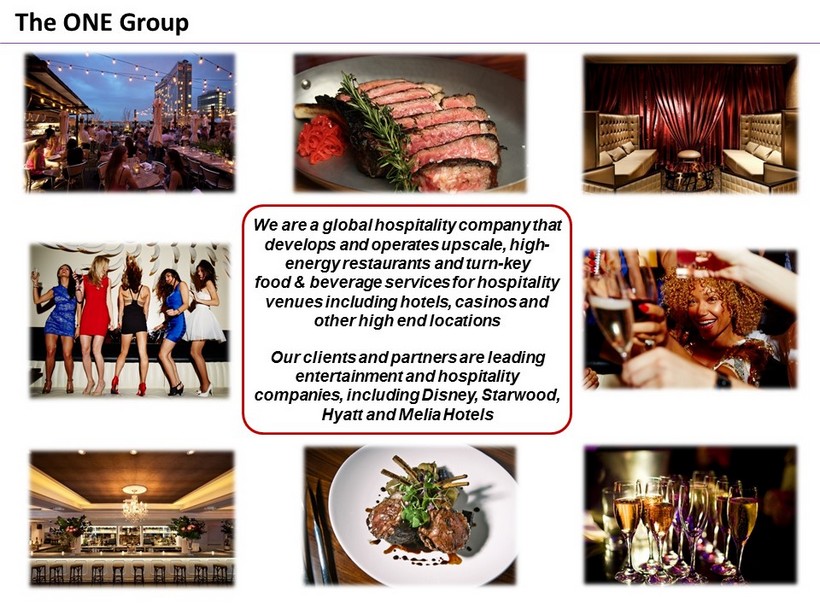
We are a global hospitality company that develops and operates upscale, high - energy restaurants and turn - key food & beverage services for hospitality venues including hotels , casinos and other high end locations Our clients and partners are leading entertainment and hospitality companies, including Disney, Starwood, Hyatt and Melia Hotels The ONE Group
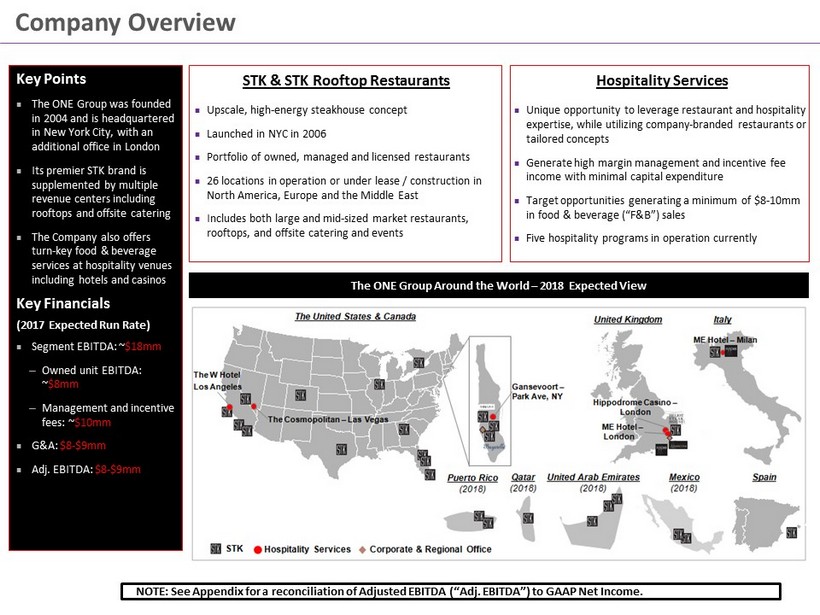
Company Overview 7 STK & STK Rooftop Restaurants Upscale, high - energy steakhouse concept Launched in NYC in 2006 Portfolio of owned, managed and licensed restaurants 26 locations in operation or under lease / construction in North America, Europe and the Middle East Includes both large and mid - sized market restaurants, rooftops, and offsite catering and events Hospitality Services Unique opportunity to leverage restaurant and hospitality expertise, while utilizing company - branded restaurants or tailored concepts Generate high margin management and incentive fee income with minimal capital expenditure Target opportunities generating a minimum of $8 - 10mm in food & beverage (“F&B”) sales Five hospitality programs in operation currently The ONE Group Around the World – 2018 Expected View Key Points The ONE Group was founded in 2004 and is headquartered in New York City, with an additional office in London Its premier STK brand is supplemented by multiple revenue centers including rooftops and offsite catering The Company also offers turn - key food & beverage services at hospitality venues including hotels and casinos Key Financials (2017 Expected Run Rate) Segment EBITDA: ~ $18mm ─ Owned unit EBITDA: ~ $8mm ─ Management and incentive fees: ~ $10mm G&A: $8 - $9mm Adj. EBITDA: $8 - $9mm NOTE: See Appendix for a reconciliation of Adjusted EBITDA (“Adj. EBITDA”) to GAAP Net Income.
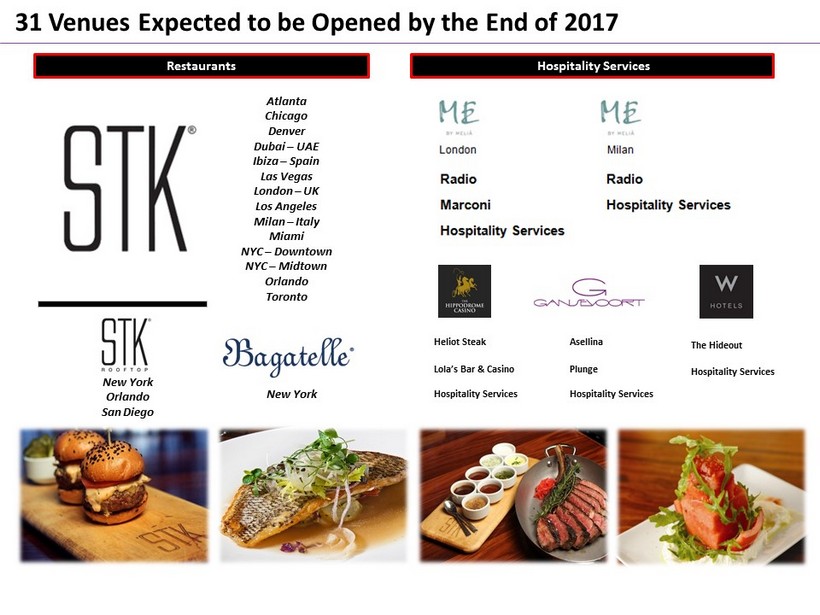
31 Venues Expected to be Opened by the End of 2017 Restaurants Hospitality Services Heliot Steak Asellina The Hideout Lola’s Bar & Casino Plunge Hospitality Services Hospitality Services Hospitality Services Atlanta Chicago Denver Dubai – UAE Ibiza – Spain Las Vegas London – UK Los Angeles Milan – Italy Miami NYC – Downtown NYC – Midtown Orlando Toronto New York Orlando San Diego New York

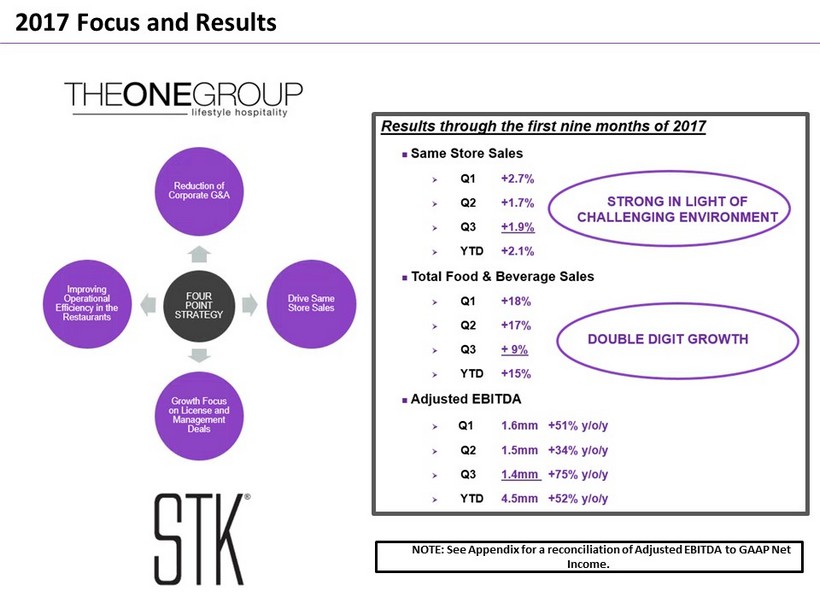
2017 Focus and Results NOTE: See Appendix for a reconciliation of Adjusted EBITDA to GAAP Net Income.
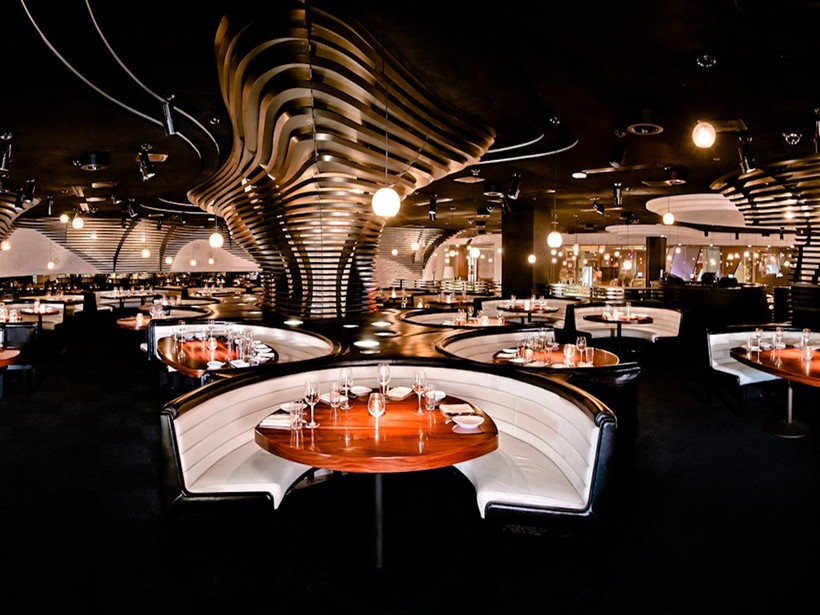
STK RESTAURANTS
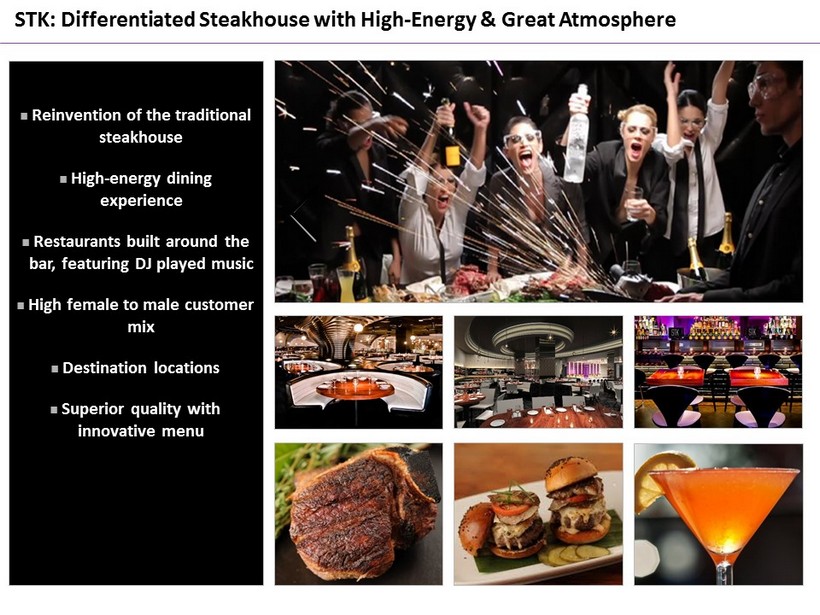
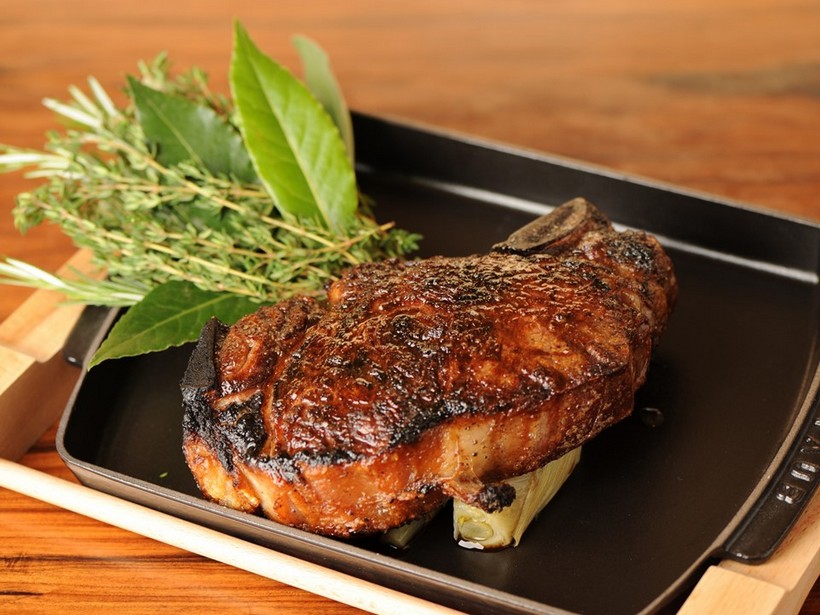
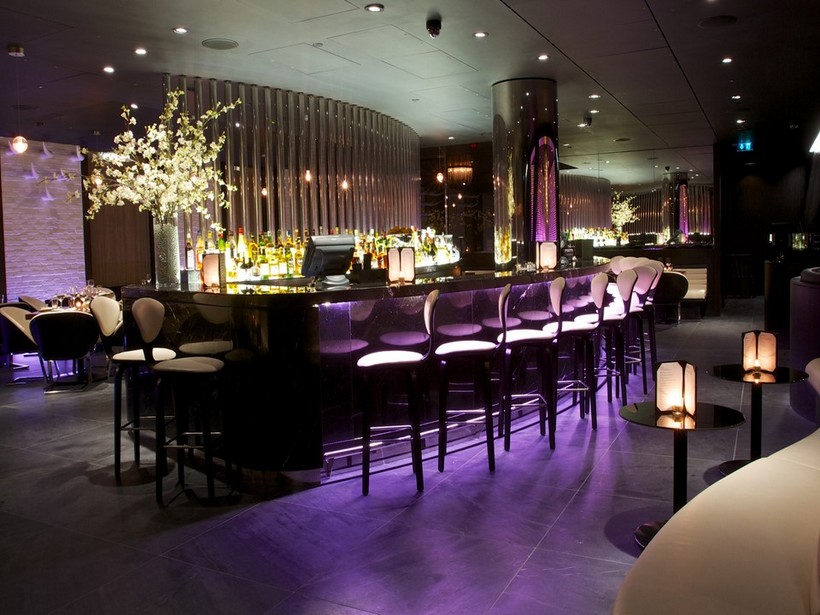
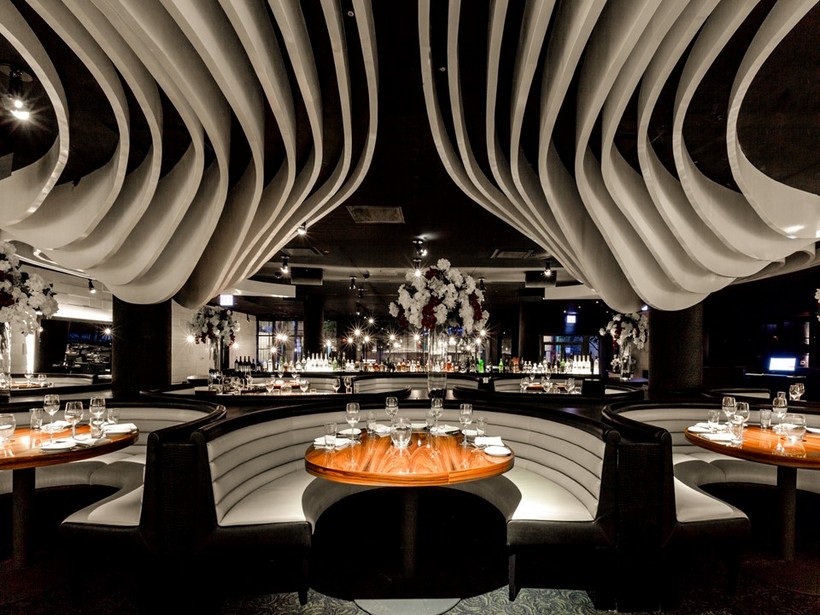
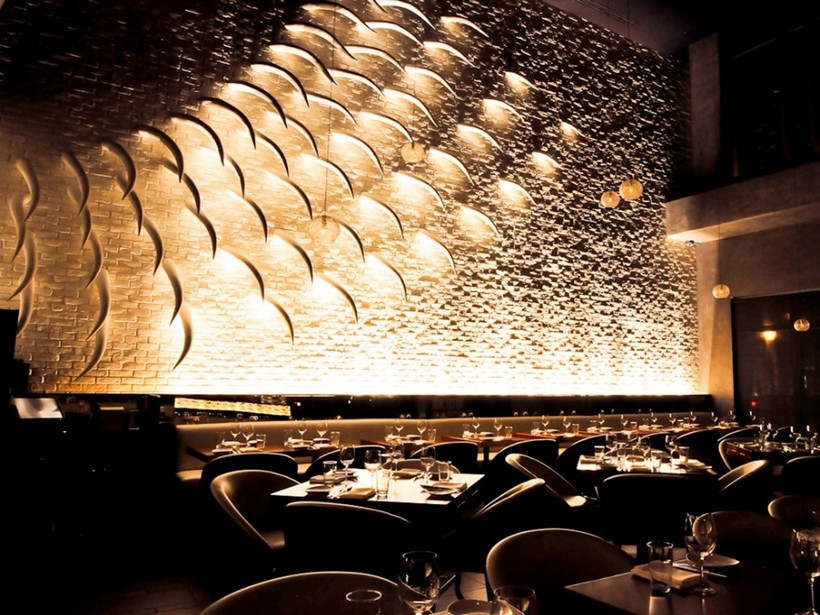
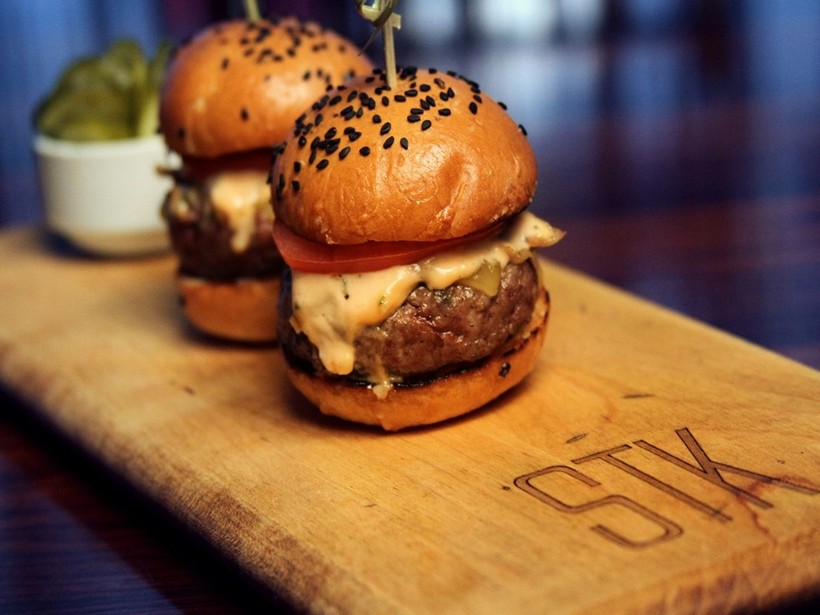
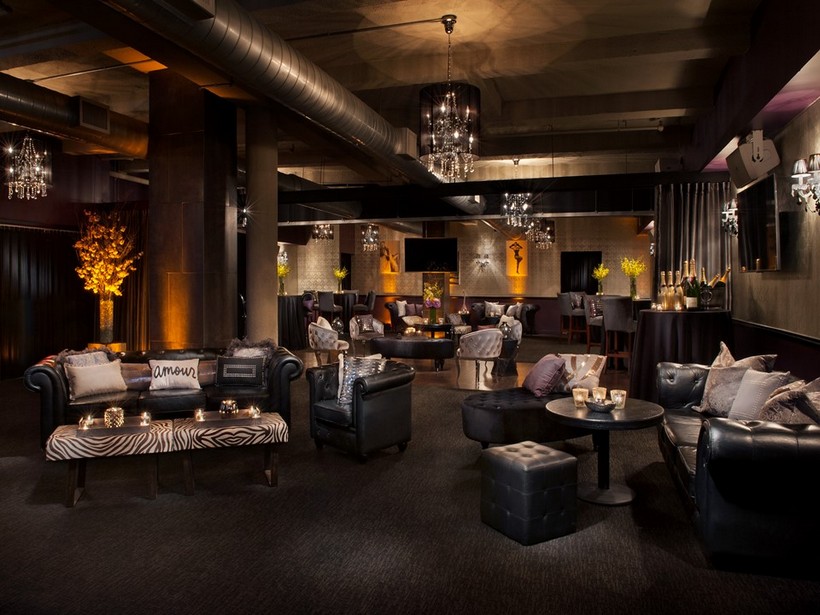
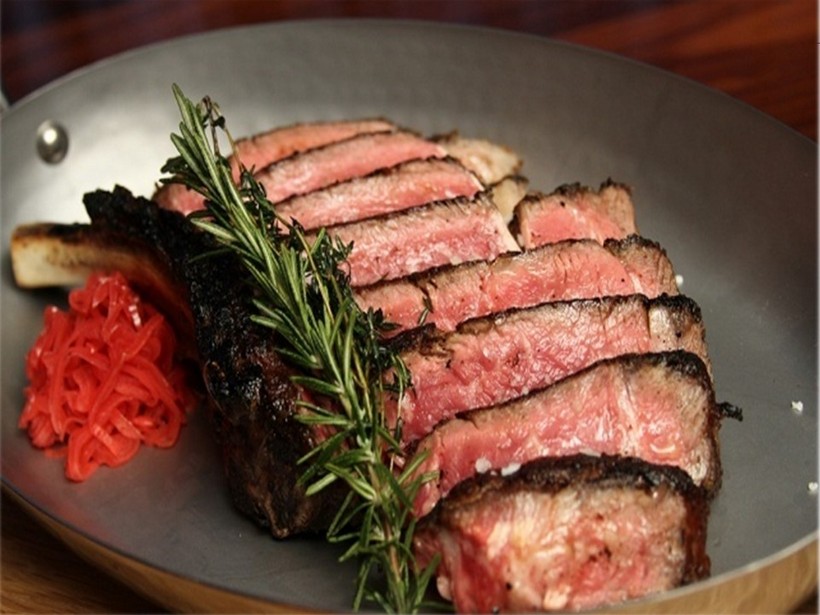
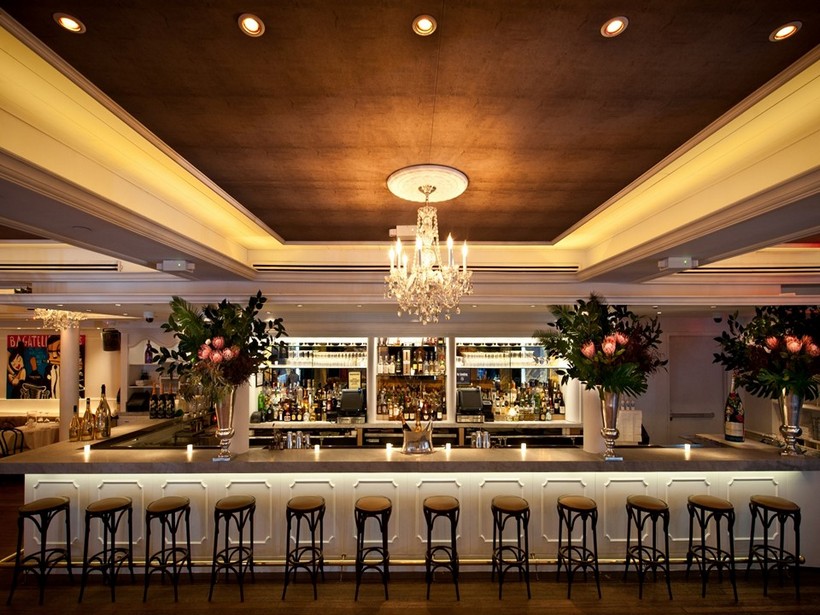
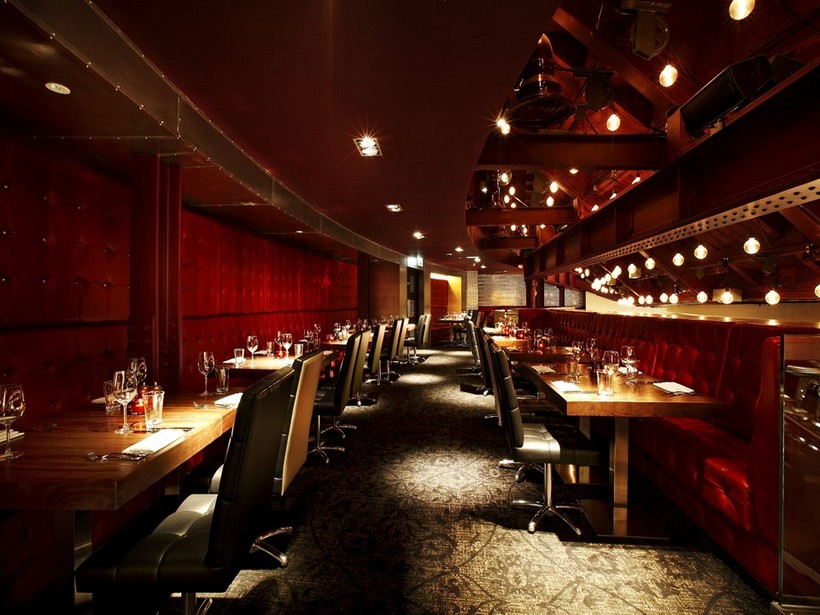
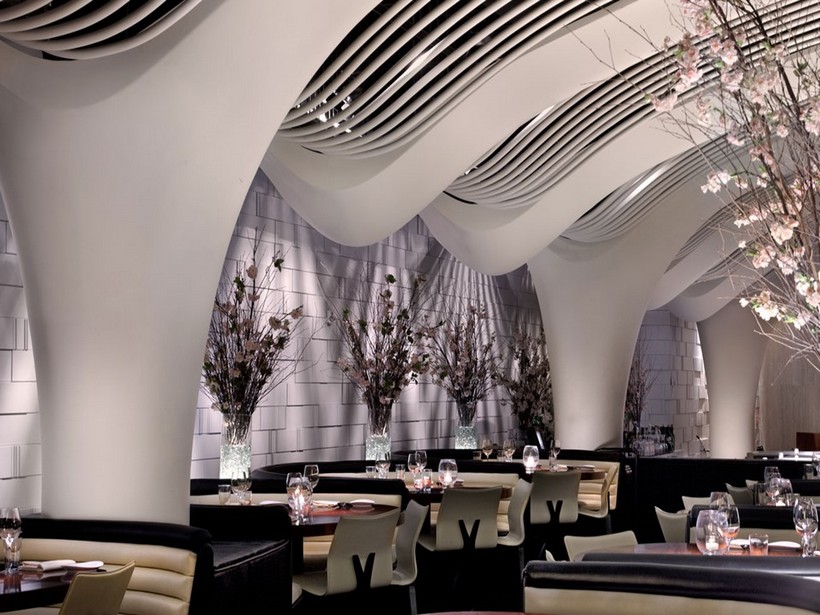
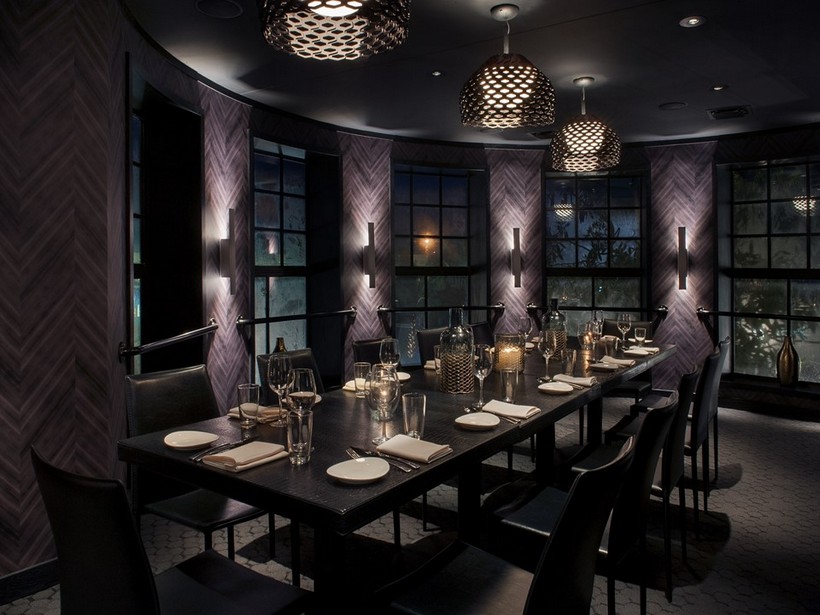
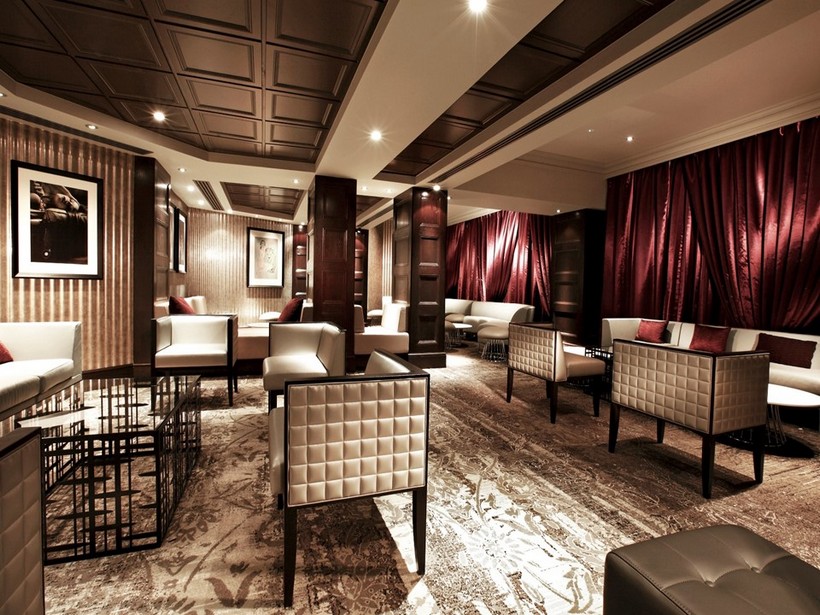
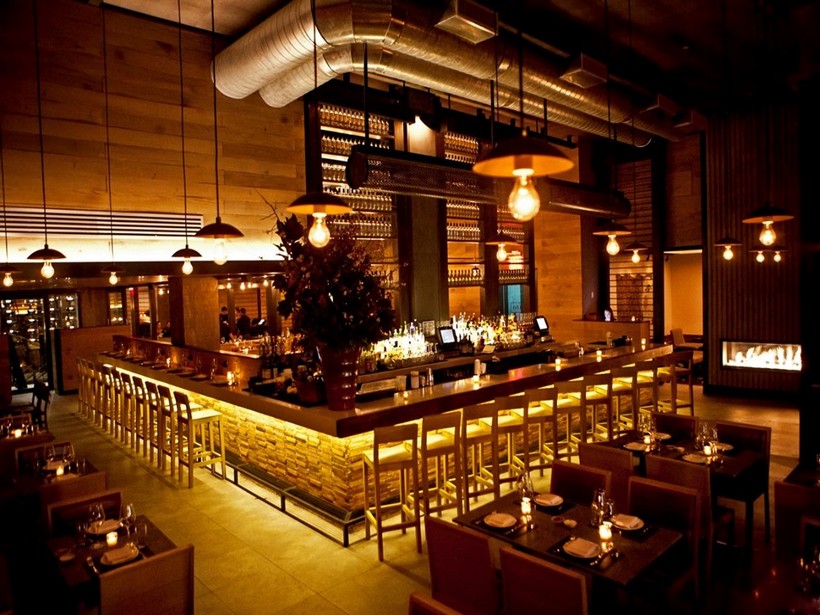
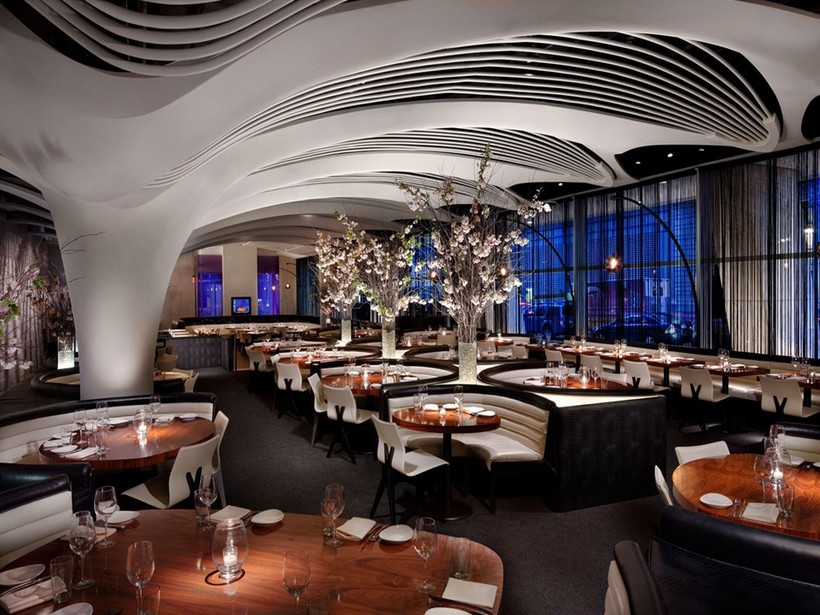
Reinvention of the traditional steakhouse High - energy dining experience Restaurants built around the bar, featuring DJ played music High female to male customer mix Destination locations Superior quality with innovative menu STK: Differentiated Steakhouse with High - Energy & Great Atmosphere
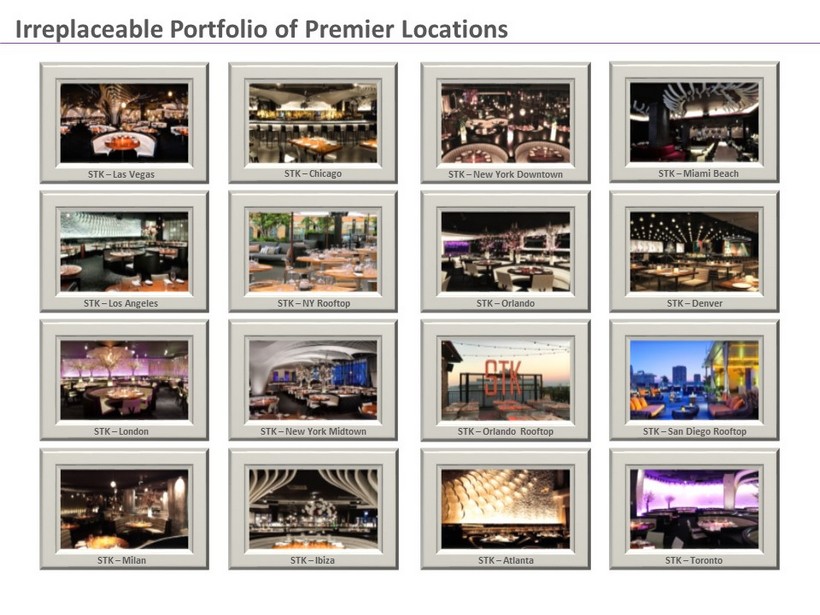
Irreplaceable Portfolio of Premier Locations 15 STK – Los Angeles STK – London STK – Milan STK – New York Downtown STK – Orlando STK – Atlanta STK – Miami Beach STK – Chicago STK – NY Rooftop STK – New York Midtown STK – Ibiza STK – Denver STK – San Diego Rooftop STK – Toronto STK – Las Vegas STK – Orlando Rooftop
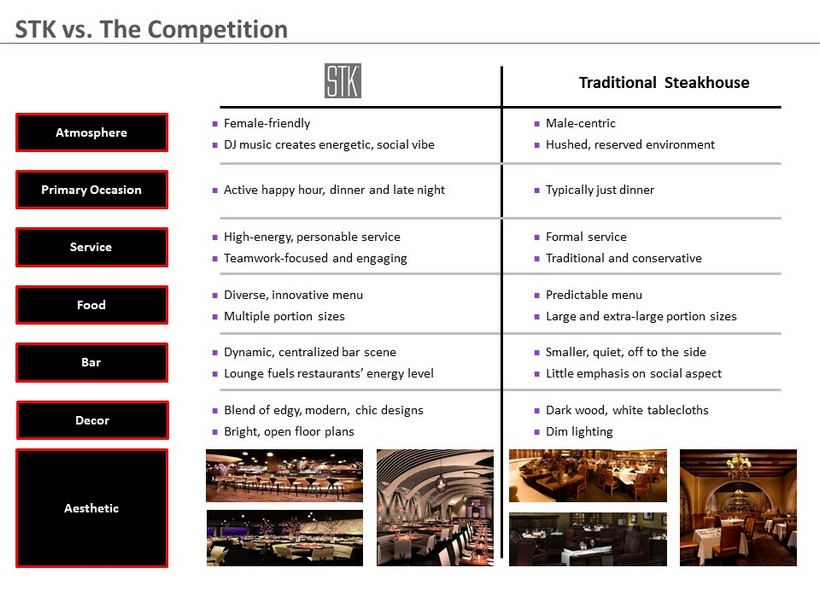
Atmosphere STK vs. The Competition 17 Food Aesthetic Decor Bar Service High - energy, personable service Teamwork - focused and engaging Diverse, innovative menu Multiple portion sizes Dynamic, centralized bar scene Lounge fuels restaurants’ energy level Blend of edgy, modern, chic designs Bright, open floor plans Female - friendly DJ music creates energetic, social vibe Active happy hour, dinner and late night Primary Occasion Male - centric Hushed, reserved environment Traditional Steakhouse Predictable menu Large and extra - large portion sizes Smaller, quiet, off to the side Little emphasis on social aspect Dark wood, white tablecloths Dim lighting Formal service Traditional and conservative Typically just dinner

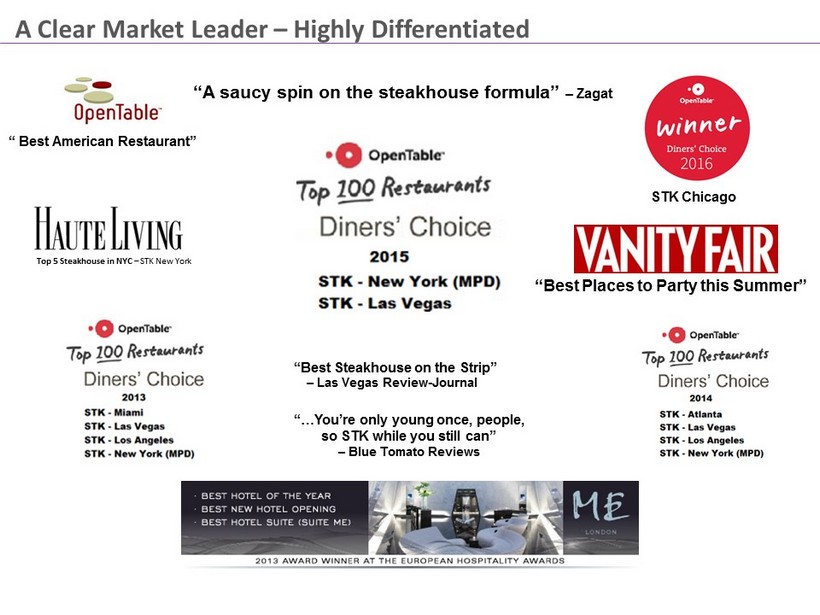
A Clear Market Leader – Highly Differentiated 19 “ “Best Steakhouse on the Strip” – Las Vegas Review - Journal “Best Places to Party this Summer” ” “A saucy spin on the steakhouse formula” – Zagat Top 5 Steakhouse in NYC – STK New York “…You’re only young once, people, so STK while you still can” – Blue Tomato Reviews “ Best American Restaurant” STK Chicago
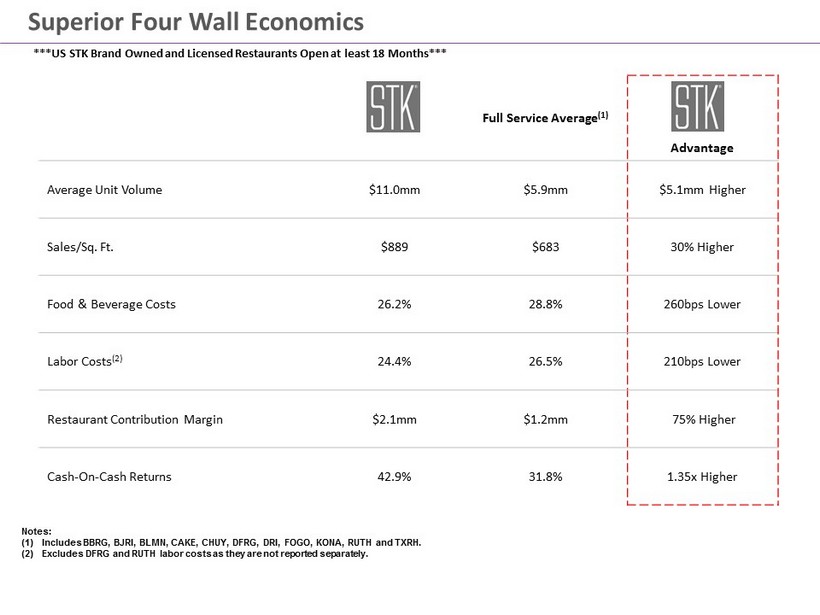
Superior Four Wall Economics 21 Full Service Average (1) Advantage Average Unit Volume $ 11.0mm $5.9mm $5.1mm Higher Sales/Sq. Ft. $889 $683 30% Higher Food & Beverage Costs 26.2% 28.8% 260bps Lower Labor Costs (2) 24.4% 26.5% 210bps Lower Restaurant Contribution Margin $2.1mm $1.2mm 75% Higher Cash - On - Cash Returns 42.9% 31.8% 1.35x Higher Notes: (1) Includes BBRG, BJRI, BLMN, CAKE, CHUY, DFRG, DRI, FOGO, KONA, RUTH and TXRH. (2) Excludes DFRG and RUTH labor costs as they are not reported separately. ***US STK Brand Owned and Licensed Restaurants Open at least 18 Months***
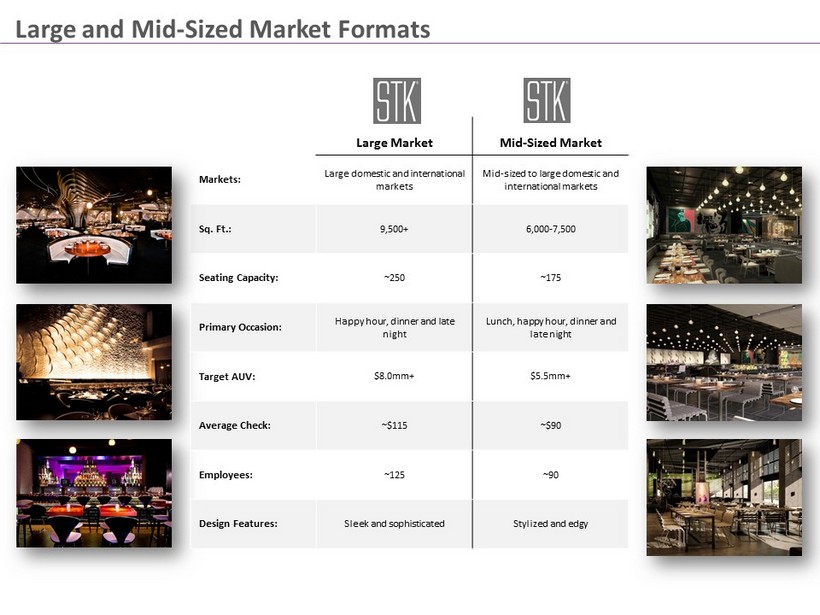
Large and Mid - Sized Market Formats 23 Large Market Mid - Sized Market Markets: Large domestic and international markets Mid - sized to large domestic and international markets Sq. Ft.: 9,500+ 6,000 - 7,500 Seating Capacity: ~250 ~175 Primary Occasion: Happy hour , dinner and late night Lunch, happy hour , dinner and late night Target AUV: $8.0mm+ $5.5mm+ Average Check: ~$ 115 ~$90 Employees: ~125 ~90 Design Features: Sleek and sophisticated Stylized and edgy
24
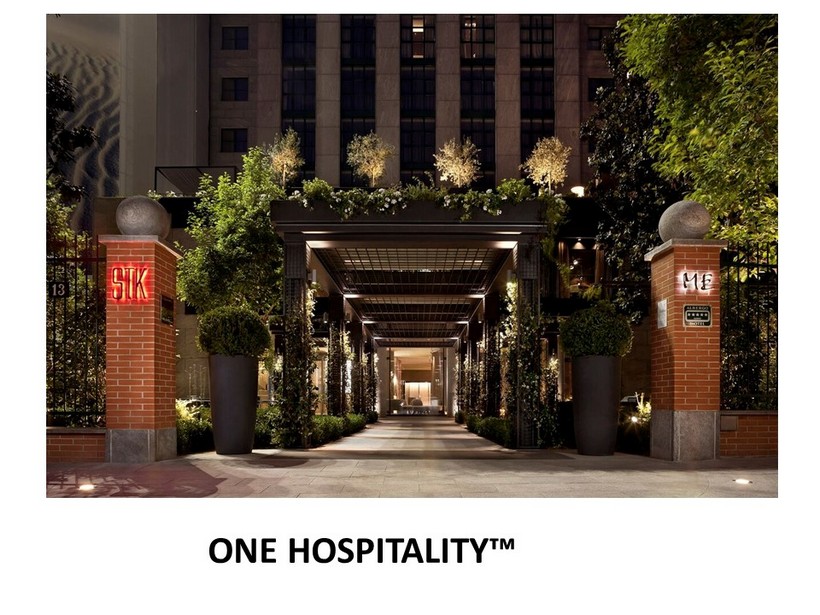
ONE HOSPITALITY™

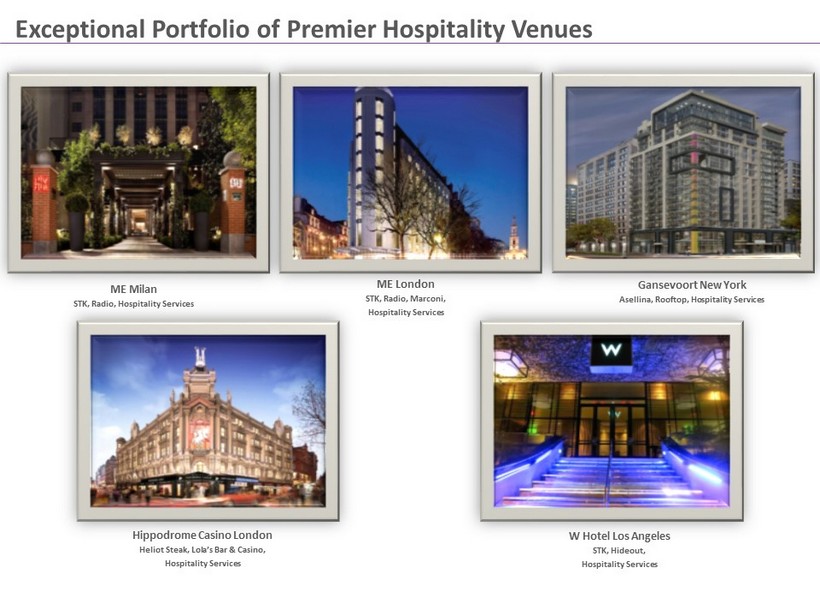
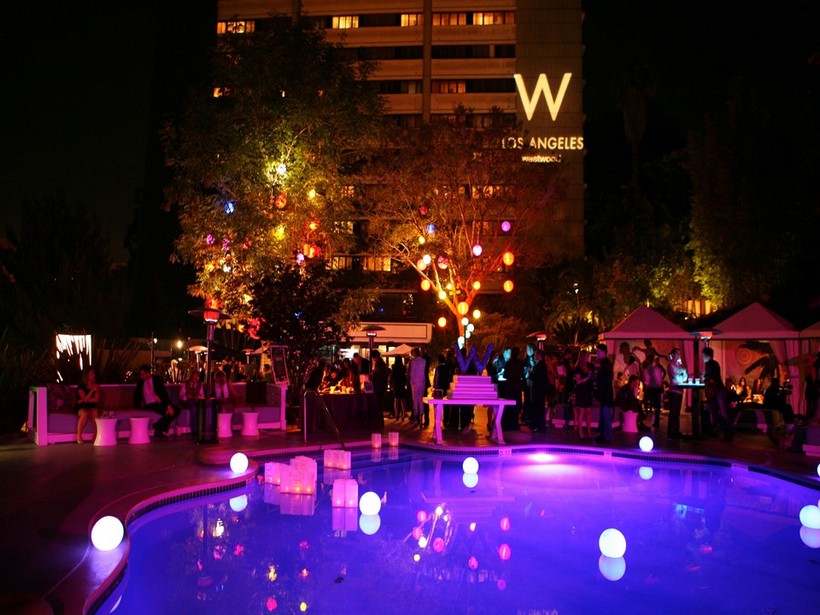
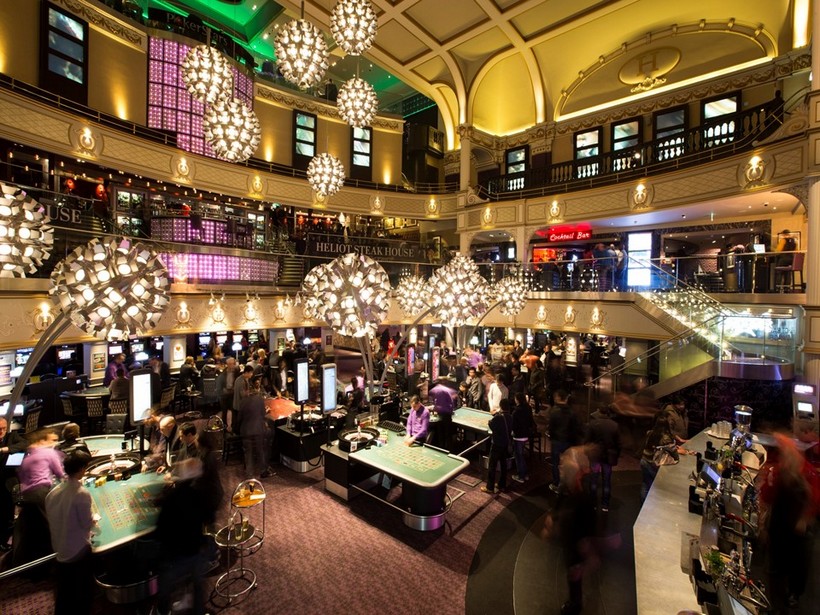
Exceptional Portfolio of Premier Hospitality Venues 27 ME London STK, Radio, Marconi, Hospitality Services ME Milan STK, Radio, Hospitality Services Hippodrome Casino London Heliot Steak, Lola’s Bar & Casino, Hospitality Services Gansevoort New York Asellina, Rooftop, Hospitality Services W Hotel Los Angeles STK, Hideout, Hospitality Services
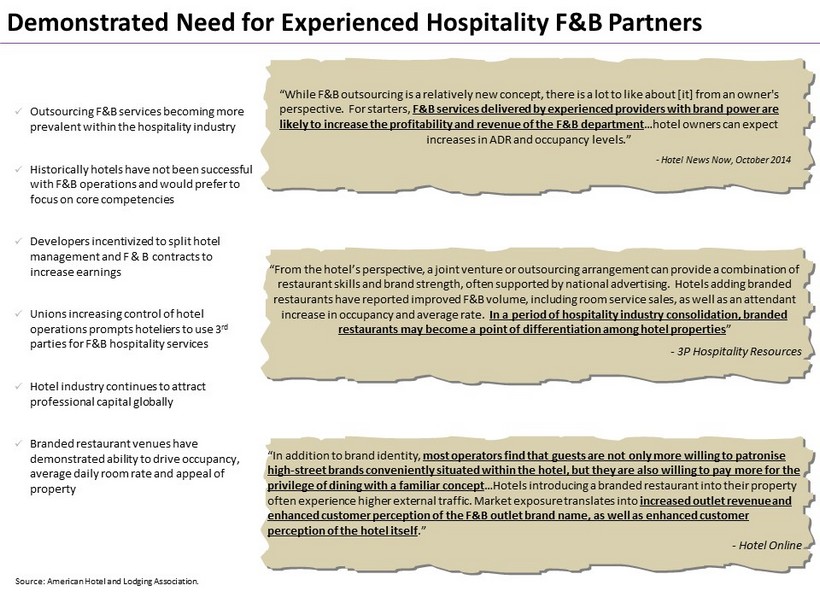
Demonstrated Need for Experienced Hospitality F&B Partners x Outsourcing F&B services becoming more prevalent within the hospitality industry x Historically hotels have not been successful with F&B operations and would prefer to focus on core competencies x Developers incentivized to split hotel management and F & B contracts to increase earnings x Unions increasing control of hotel operations prompts hoteliers to use 3 rd parties for F&B hospitality services x Hotel industry continues to attract professional capital globally x Branded restaurant venues have demonstrated ability to drive occupancy, average daily room rate and appeal of property “While F&B outsourcing is a relatively new concept, there is a lot to like about [it] from an owner's perspective. For starters, F&B services delivered by experienced providers with brand power are likely to increase the profitability and revenue of the F&B department …hotel owners can expect increases in ADR and occupancy levels.” - Hotel News Now, October 2014 Source: American Hotel and Lodging Association. “From the hotel’s perspective, a joint venture or outsourcing arrangement can provide a combination of restaurant skills and brand strength, often supported by national advertising. Hotels adding branded restaurants have reported improved F&B volume, including room service sales, as well as an attendant increase in occupancy and average rate. In a period of hospitality industry consolidation, branded restaurants may become a point of differentiation among hotel properties ” - 3P Hospitality Resources “ In addition to brand identity, most operators find that guests are not only more willing to patronise high - street brands conveniently situated within the hotel, but they are also willing to pay more for the privilege of dining with a familiar concept …Hotels introducing a branded restaurant into their property often experience higher external traffic. Market exposure translates into increased outlet revenue and enhanced customer perception of the F&B outlet brand name, as well as enhanced customer perception of the hotel itself .” - Hotel Online
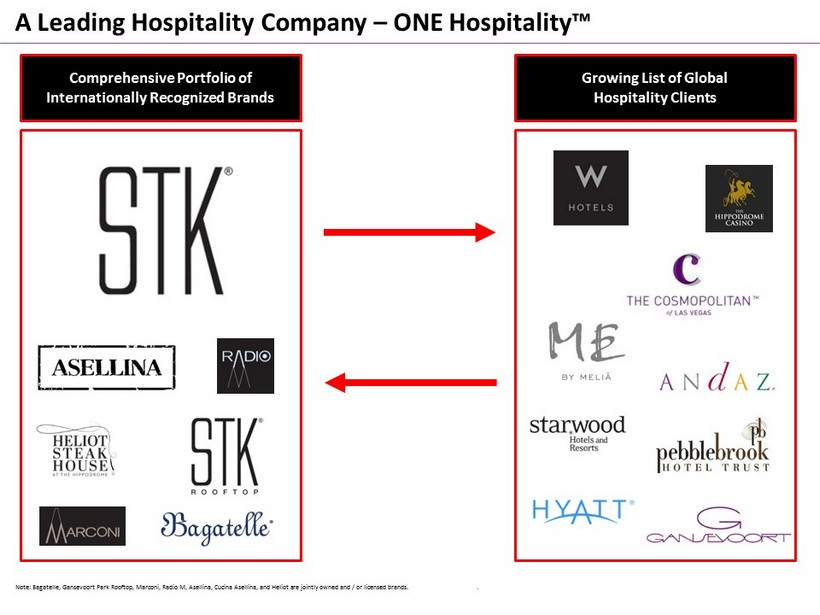
A Leading Hospitality Company – ONE Hospitality™ Note: Bagatelle, Gansevoort Park Rooftop, Marconi, Radio M, Asellina, Cucina Asellina, and Heliot are jointly owned and / or licensed brands. and / or licensed brands . Comprehensive Portfolio of Internationally Recognized Brands Growing List of Global Hospitality Clients
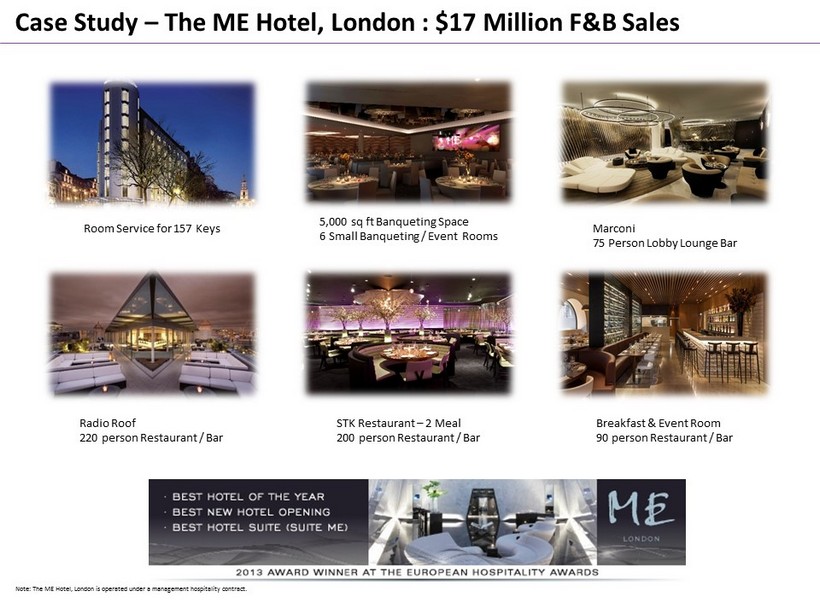
Case Study – The ME Hotel, London : $17 Million F&B Sales Room Service for 157 Keys 5,000 sq ft Banqueting Space 6 Small Banqueting / Event Rooms Marconi 75 Person Lobby Lounge Bar Radio Roof 220 person Restaurant / Bar STK Restaurant – 2 Meal 200 person Restaurant / Bar Breakfast & Event Room 90 person Restaurant / Bar Note: The ME Hotel, London is operated under a management hospitality contract.
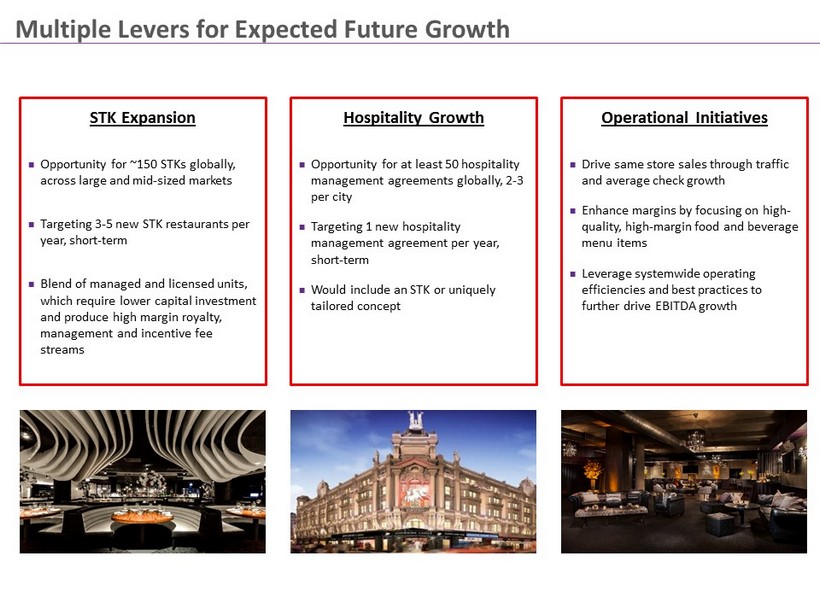
Multiple Levers for Expected Future Growth 35 STK Expansion Opportunity for ~150 STKs globally, across large and mid - sized markets Targeting 3 - 5 new STK restaurants per year, short - term Blend of managed and licensed units, which require lower capital investment and produce high margin royalty, management and incentive fee streams Hospitality Growth Opportunity for at least 50 hospitality management agreements globally, 2 - 3 per city Targeting 1 new hospitality management agreement per year, short - term Would include an STK or uniquely tailored concept Operational Initiatives Drive same store sales through traffic and average check growth Enhance margins by focusing on high - quality, high - margin food and beverage menu items Leverage systemwide operating efficiencies and best practices to further drive EBITDA growth

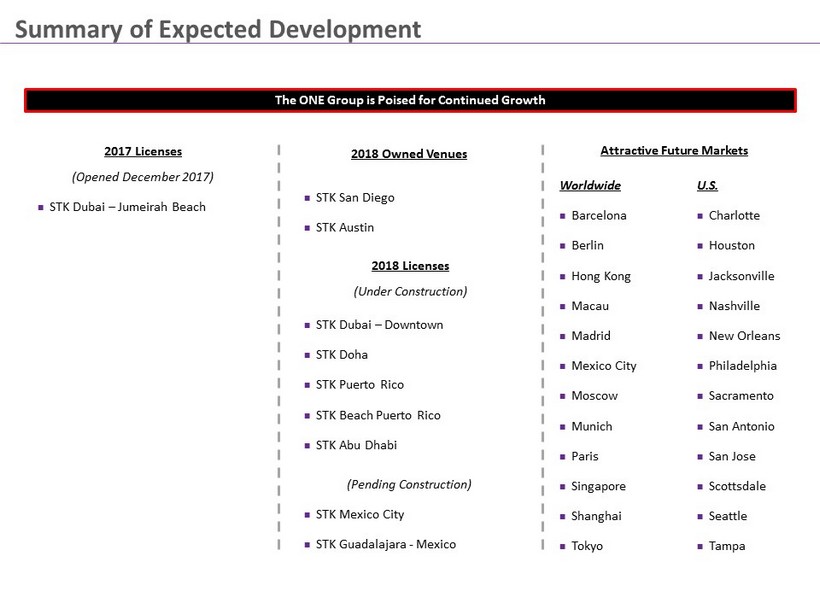
STK Dubai – Downtown STK Doha STK Puerto Rico STK Beach Puerto Rico STK Abu Dhabi Summary of Expected Development 37 The ONE Group is Poised for Continued Growth Attractive Future Markets Worldwide Barcelona Berlin Hong Kong Macau Madrid Mexico City Moscow Munich Paris Singapore Shanghai Tokyo 2017 Licenses (Opened December 2017) STK Dubai – Jumeirah Beach (Pending Construction) STK Mexico City STK Guadalajara - Mexico U.S . Charlotte Houston Jacksonville Nashville New Orleans Philadelphia Sacramento San Antonio San Jose Scottsdale Seattle Tampa 2018 Licenses (Under Construction) 2018 Owned Venues STK San Diego STK Austin
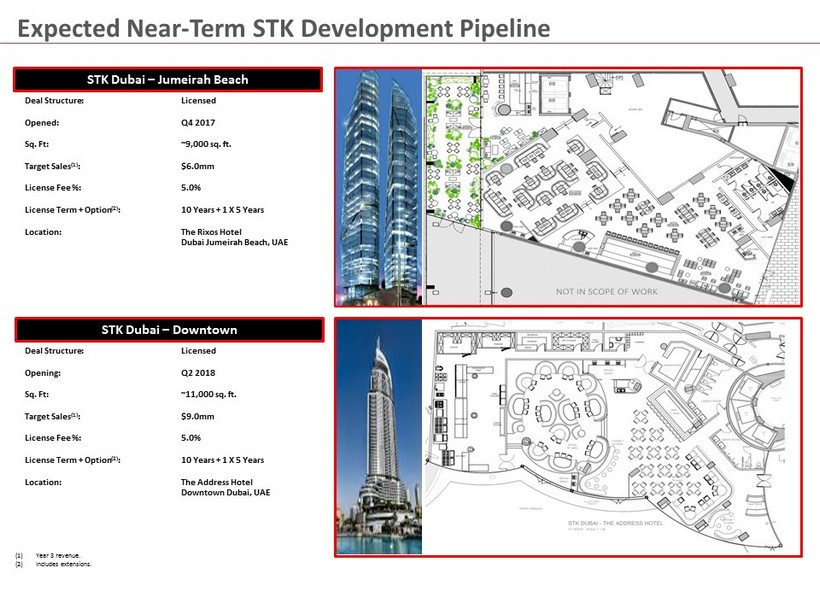
Expected Near - Term STK Development Pipeline 39 STK Dubai – Jumeirah Beach STK Dubai – Downtown Deal Structure: Opened: Sq. Ft: Target Sales (1) : License Fee %: License Term + Option (2) : Location: Licensed Q4 2017 ~9,000 sq. ft. $6.0mm 5.0% 10 Years + 1 X 5 Years The Rixos Hotel Dubai Jumeirah Beach, UAE (1) Year 3 revenue. (2) Includes extensions. Deal Structure: Opening: Sq. Ft: Target Sales (1) : License Fee %: License Term + Option (2) : Location: Licensed Q2 2018 ~11,000 sq. ft. $9.0mm 5.0% 10 Years + 1 X 5 Years The Address Hotel Downtown Dubai, UAE
40

Expected Near - Term STK Development Pipeline 41 STK San Diego Deal Structure: Opening: Sq. Ft: Target Sales (1) : Target 4 - Wall Margin (2) : Lease Expiration (3) : Base Rent/Mo: % Rent: Location: Owned Q2 2018 ~4,300 sq. ft. $4.6mm 15% January 2036 $27,300 6.0% The Andaz Hotel San Diego, CA (1) Year 3 revenue. (2) 4 - wall margin before allocated G&A. (3) Includes extensions. STK Doha Deal Structure: Opening: Sq. Ft: Target Sales (1) : License Fee %: License Term + Option (3) : Location: Licensed Q3 2018 ~7,000 sq. ft. $5.0mm 5.0% 10 Years + 1 X 5 Years The Ritz Carlton Hotel Doha, Qatar

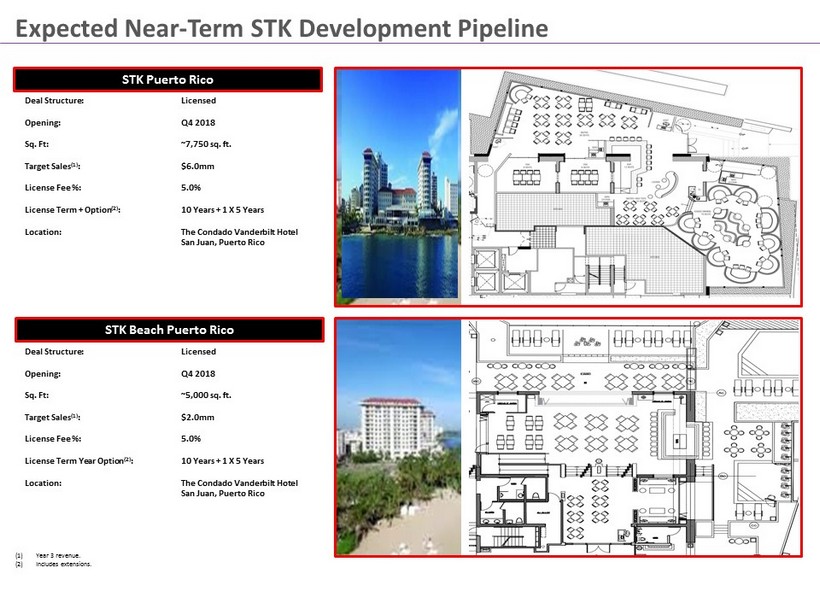
Expected Near - Term STK Development Pipeline 43 STK Puerto Rico STK Beach Puerto Rico Deal Structure: Opening: Sq. Ft: Target Sales (1) : License Fee %: License Term + Option (2) : Location: Licensed Q4 2018 ~7,750 sq. ft. $6.0mm 5.0% 10 Years + 1 X 5 Years The Condado Vanderbilt Hotel San Juan, Puerto Rico Deal Structure: Opening: Sq. Ft: Target Sales (1) : License Fee %: License Term Year Option (2) : Location: Licensed Q4 2018 ~5,000 sq. ft. $2.0mm 5.0% 10 Years + 1 X 5 Years The Condado Vanderbilt Hotel San Juan, Puerto Rico (1) Year 3 revenue. (2) Includes extensions.
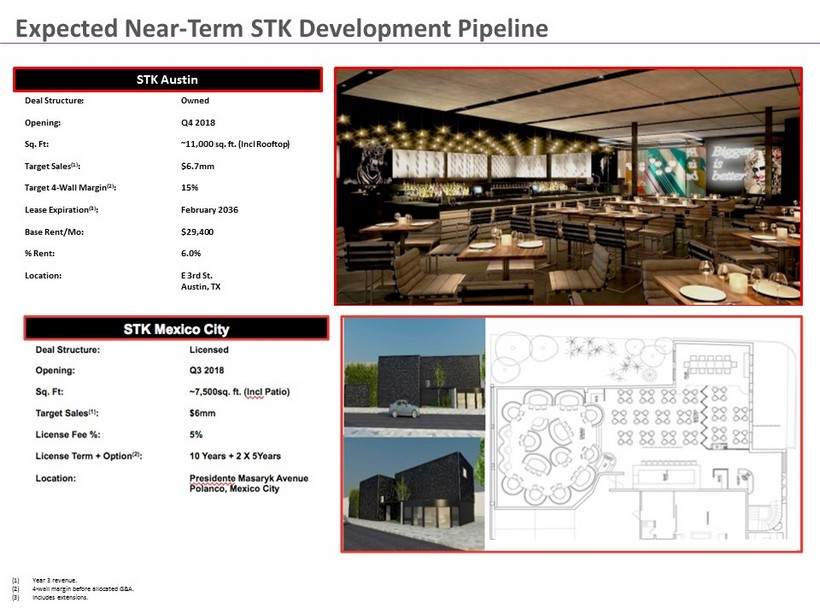
Expected Near - Term STK Development Pipeline 45 STK Austin Deal Structure: Opening: Sq. Ft: Target Sales (1) : Target 4 - Wall Margin (2) : Lease Expiration (3) : Base Rent/Mo: % Rent: Location: Owned Q4 2018 ~11,000 sq. ft. (Incl Rooftop) $6.7mm 15% February 2036 $29,400 6.0% E 3rd St. Austin, TX (1) Year 3 revenue. (2) 4 - wall margin before allocated G&A. (3) Includes extensions.
FINANCIAL REVIEW
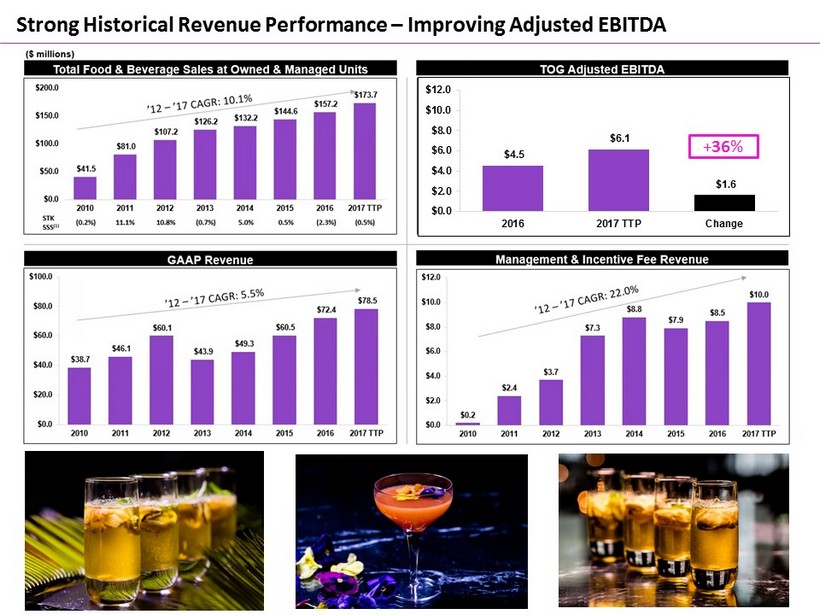
Strong Historical Revenue Performance – Improving Adjusted EBITDA $4.5 $6.1 $1.6 $0.0 $2.0 $4.0 $6.0 $8.0 $10.0 $12.0 2016 2017 TTP Change + 36 %

2017 Focus and Results NOTE: See Appendix for a reconciliation of Adjusted EBITDA to GAAP Net Income.

52
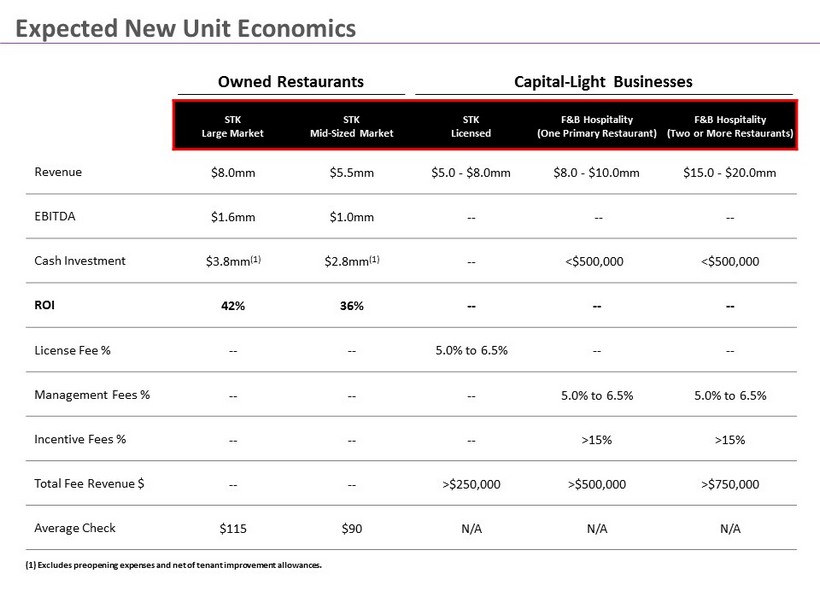
Expected New Unit Economics 53 STK Large Market STK Mid - Sized Market STK Licensed F&B Hospitality (One Primary Restaurant) F&B Hospitality (Two or More Restaurants) Revenue $8.0mm $5.5mm $5.0 - $8.0mm $8.0 - $10.0mm $15.0 - $20.0 mm EBITDA $ 1.6mm $1.0mm -- -- -- Cash Investment $3.8mm (1) $ 2.8mm (1 ) -- <$500,000 <$500,000 ROI 42% 36% -- -- -- License Fee % -- -- 5.0% to 6.5% -- -- Management Fees % -- -- -- 5.0% to 6.5% 5.0% to 6.5% Incentive Fees % -- -- -- >15% >15% Total Fee Revenue $ -- -- >$250,000 >$500,000 >$750,000 Average Check $115 $90 N/A N/A N/A (1) Excludes preopening expenses and net of tenant improvement allowances. N Owned Restaurants Capital - Light Businesses

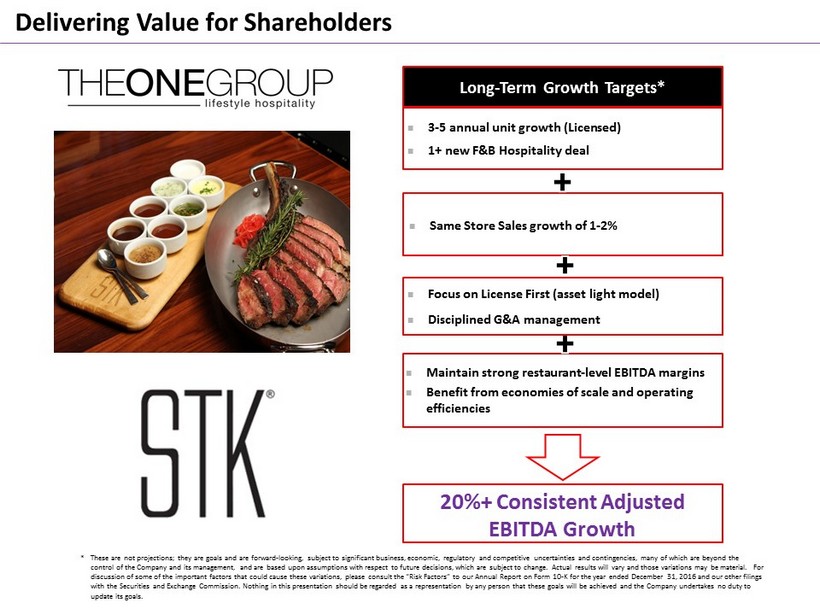
* These are not projections; they are goals and are forward - looking, subject to significant business, economic, regulatory and competitive uncertainties and contingencies, many of which are beyond the control of the Company and its management, and are based upon assumptions with respect to future decisions, which are subject to change. Actual results will vary and those variations may be material. For discussion of some of the important factors that could cause these variations, please consult the “Risk Factors” to our Annua l R eport on Form 10 - K for the year ended December 31, 2016 and our other filings with the Securities and Exchange Commission. Nothing in this presentation should be regarded as a representation by any perso n t hat these goals will be achieved and the Company undertakes no duty to update its goals. 3 - 5 annual unit growth (Licensed) 1+ new F&B Hospitality deal 20%+ Consistent Adjusted EBITDA Growth Long - Term Growth Targets* Same Store Sales growth of 1 - 2 % Maintain strong restaurant - level EBITDA margins Benefit from economies of scale and operating efficiencies Focus on License First (asset light model) Disciplined G&A management Delivering Value for Shareholders

56
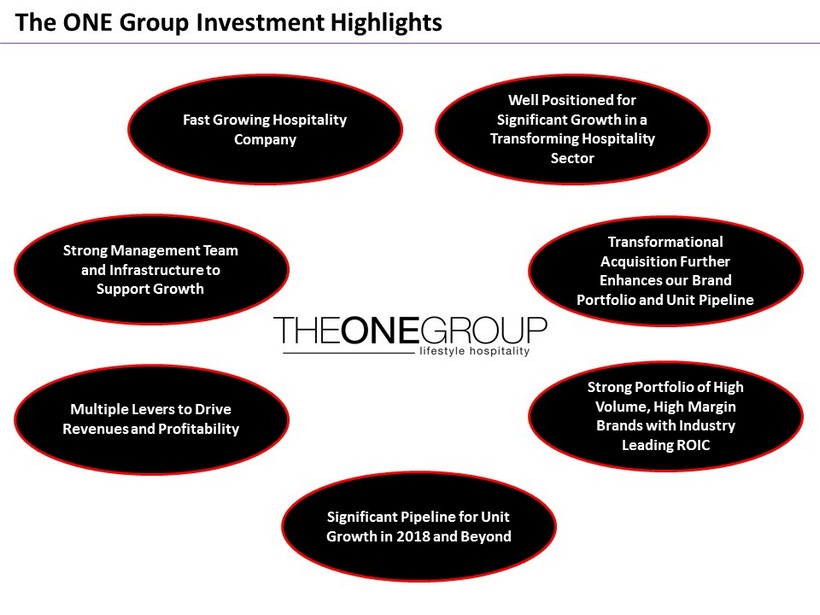
Fast Growing Hospitality Company Transformational Acquisition Further Enhances our Brand Portfolio and Unit Pipeline Strong Management Team and Infrastructure to Support Growth Multiple Levers to Drive Revenues and Profitability Strong Portfolio of High Volume, High Margin Brands with Industry Leading ROIC Significant Pipeline for Unit Growth in 2018 and Beyond Well Positioned for Significant Growth in a Transforming Hospitality Sector The ONE Group Investment Highlights

APPENDIX
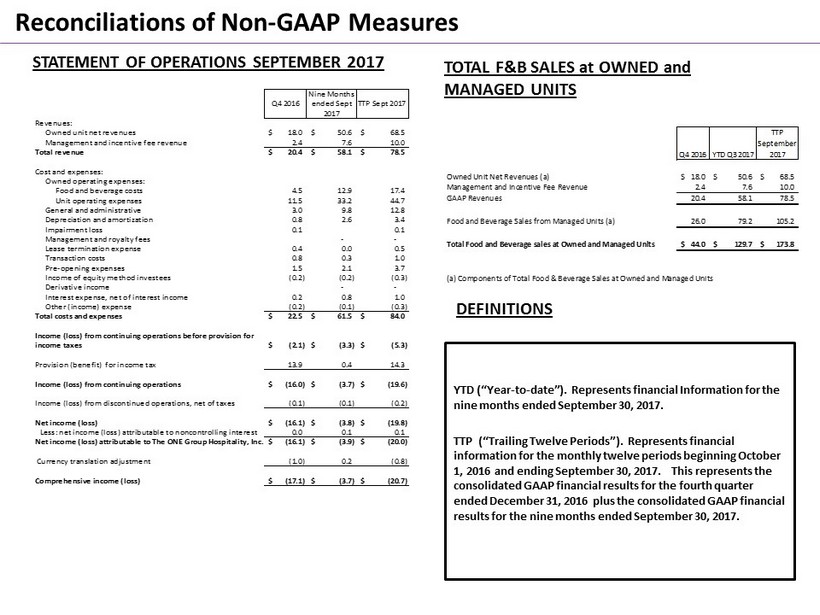
Reconciliations of Non - GAAP Measures STATEMENT OF OPERATIONS SEPTEMBER 2017 TOTAL F&B SALES at OWNED and MANAGED UNITS Q4 2016 Nine Months ended Sept 2017 TTP Sept 2017 Revenues: Owned unit net revenues 18.0$ 50.6$ 68.5$ Management and incentive fee revenue 2.4 7.6 10.0 Total revenue 20.4$ 58.1$ 78.5$ Cost and expenses: Owned operating expenses: Food and beverage costs 4.5 12.9 17.4 Unit operating expenses 11.5 33.2 44.7 General and administrative 3.0 9.8 12.8 Depreciation and amortization 0.8 2.6 3.4 Impairment loss 0.1 0.1 Management and royalty fees - - Lease termination expense 0.4 0.0 0.5 Transaction costs 0.8 0.3 1.0 Pre-opening expenses 1.5 2.1 3.7 Income of equity method investees (0.2) (0.2) (0.3) Derivative income - - Interest expense, net of interest income 0.2 0.8 1.0 Other (income) expense (0.2) (0.1) (0.3) Total costs and expenses 22.5$ 61.5$ 84.0$ Income (loss) from continuing operations before provision for income taxes (2.1)$ (3.3)$ (5.3)$ Provision (benefit) for income tax 13.9 0.4 14.3 Income (loss) from continuing operations (16.0)$ (3.7)$ (19.6)$ Income (loss) from discontinued operations, net of taxes (0.1) (0.1) (0.2) Net income (loss) (16.1)$ (3.8)$ (19.8)$ Less: net income (loss) attributable to noncontrolling interest 0.0 0.1 0.1 Net income (loss) attributable to The ONE Group Hospitality, Inc. (16.1)$ (3.9)$ (20.0)$ Currency translation adjustment (1.0) 0.2 (0.8) Comprehensive income (loss) (17.1)$ (3.7)$ (20.7)$ Q4 2016 YTD Q3 2017 TTP September 2017 Owned Unit Net Revenues (a) 18.0$ 50.6$ 68.5$ Management and Incentive Fee Revenue 2.4 7.6 10.0 GAAP Revenues 20.4 58.1 78.5 Food and Beverage Sales from Managed Units (a) 26.0 79.2 105.2 Total Food and Beverage sales at Owned and Managed Units 44.0$ 129.7$ 173.8$ (a) Components of Total Food & Beverage Sales at Owned and Managed Units YTD (“Year - to - date”). Represents financial Information for the nine months ended September 30, 2017. TTP (“Trailing Twelve Periods”). Represents financial information for the monthly twelve periods beginning October 1, 2016 and ending September 30, 2017. This represents the consolidated GAAP financial results for the fourth quarter ended December 31, 2016 plus the consolidated GAAP financial results for the nine months ended September 30, 2017. DEFINITIONS
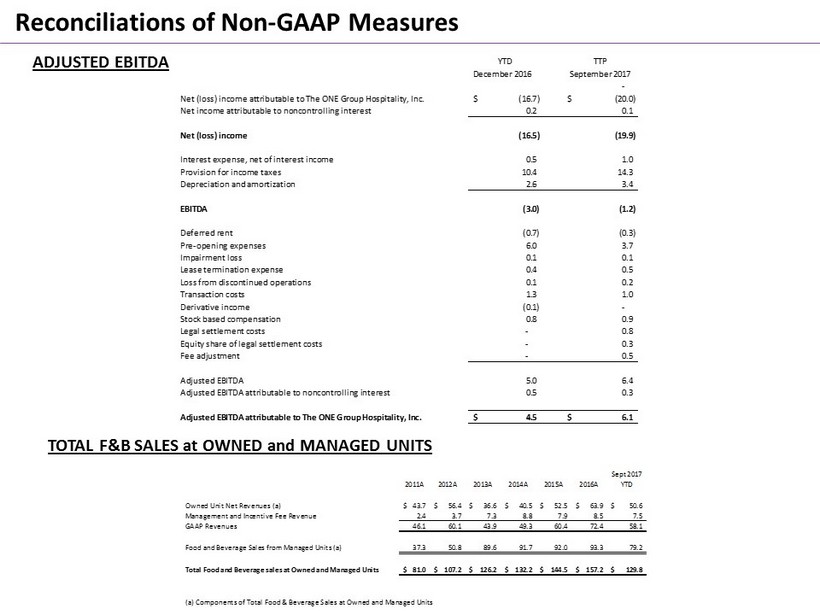
Reconciliations of Non - GAAP Measures YTD TTP December 2016 September 2017 - Net (loss) income attributable to The ONE Group Hospitality, Inc. (16.7)$ (20.0)$ Net income attributable to noncontrolling interest 0.2 0.1 Net (loss) income (16.5) (19.9) Interest expense, net of interest income 0.5 1.0 Provision for income taxes 10.4 14.3 Depreciation and amortization 2.6 3.4 EBITDA (3.0) (1.2) Deferred rent (0.7) (0.3) Pre-opening expenses 6.0 3.7 Impairment loss 0.1 0.1 Lease termination expense 0.4 0.5 Loss from discontinued operations 0.1 0.2 Transaction costs 1.3 1.0 Derivative income (0.1) - Stock based compensation 0.8 0.9 Legal settlement costs - 0.8 Equity share of legal settlement costs - 0.3 Fee adjustment - 0.5 Adjusted EBITDA 5.0 6.4 Adjusted EBITDA attributable to noncontrolling interest 0.5 0.3 Adjusted EBITDA attributable to The ONE Group Hospitality, Inc. 4.5$ 6.1$ 2011A 2012A 2013A 2014A 2015A 2016A Sept 2017 YTD Owned Unit Net Revenues (a) 43.7$ 56.4$ 36.6$ 40.5$ 52.5$ 63.9$ 50.6$ Management and Incentive Fee Revenue 2.4 3.7 7.3 8.8 7.9 8.5 7.5 GAAP Revenues 46.1 60.1 43.9 49.3 60.4 72.4 58.1 Food and Beverage Sales from Managed Units (a) 37.3 50.8 89.6 91.7 92.0 93.3 79.2 Total Food and Beverage sales at Owned and Managed Units 81.0$ 107.2$ 126.2$ 132.2$ 144.5$ 157.2$ 129.8$ (a) Components of Total Food & Beverage Sales at Owned and Managed Units ADJUSTED EBITDA TOTAL F&B SALES at OWNED and MANAGED UNITS