Cautionary Statements In addition to historical information, this presentation contains statements relating to the Company’s future business and financial performance and future events or developments that may constitute “forward-looking statements” within the meaning of the “safe harbor” provisions of the United States Private Securities Litigation Reform Act of 1995 . These statements are based on current expectations and assumptions that are subject to certain risks and uncertainties. These statements include forward-looking statements with respect to the Company’s business and industry in general. Statements that include the words “expect,” “intend,” “plan,” “believe,” “project,” “forecast,” “estimate,” “may,” “should,” “anticipate” and similar statements of a future or forward-looking nature identify forward-looking statements for purposes of the federal securities laws or otherwise. A variety of factors, many of which are beyond the Company’s control, affect the Company’s operations, performance, business strategies and results and there can be no assurance that the Company’s actual results will not differ materially from those indicated in these statements. These factors include, but are not limited to, continued compliance with governmental regulation, the ability to manage growth, requirements or changes affecting the business in which the Company is engaged, general economic and business conditions and the Company’s ability to open new restaurants and food and beverage locations in current and additional markets. More detailed information about these factors may be found in the Company’s filings with the Securities and Exchange Commission, including its Annual Report on Form 10-K for the year ended December 31, 2013. The statements made herein speak only as of the date of this presentation. The Company undertakes no obligation to update its forward-looking statements to reflect evens or circumstances after the date of this presentation. This presentation contains certain non-GAAP financial measures. A “non-GAAP financial measure” is defined as a numerical measure of a company’s financial performance that excludes or includes amounts so as to be different than the most directly comparable measure calculated and presented in accordance with GAAP in the statements of income, balance sheets or statements of cash flow of the Company. These measures are presented because management uses this information to monitor and evaluate financial results and trends and believes this information to also be useful for investors. The Company has both wholly-owned and partially-owned subsidiaries. Total food and beverage sales at owned and managed units represents our total revenue from our owned operations as well as the revenue reported to us with respect to sales at our managed locations, where we earn management and incentive fees at these locations. EBITDA is defined as net income before interest expense, provision for income taxes and depreciation and amortization. Adjusted EBITDA represents net income before interest expense, provision for income taxes, depreciation and amortization, non-cash impairment loss, deferred rent, pre-opening expenses, non-recurring gains and losses and losses from discontinued operations. Adjusted net income represents net income before loss from discontinued operations, non-recurring gains, non-cash impairment losses, and non-recurring acceleration of depreciation. The disclosure of EBITDA, Adjusted EBITDA and Adjusted Net Income and other non-GAAP financial measures may not be comparable to similarly titled measures reported by other companies. EBITDA, Adjusted EBITDA and Adjusted Net Income should be considered in addition to, and not as a substitute, or superior to, net income, operating income, cash flows, revenue, or other measured of financial performance prepared in accordance with GAAP. For a reconciliation of Total food and beverage sales at owned and managed units, EBITDA, Adjusted EBITDA and Adjusted Net Income to the most directly comparable financial measures presented in accordance with GAAP and a discussion of why we consider them useful, see the Appendix to this presentation.
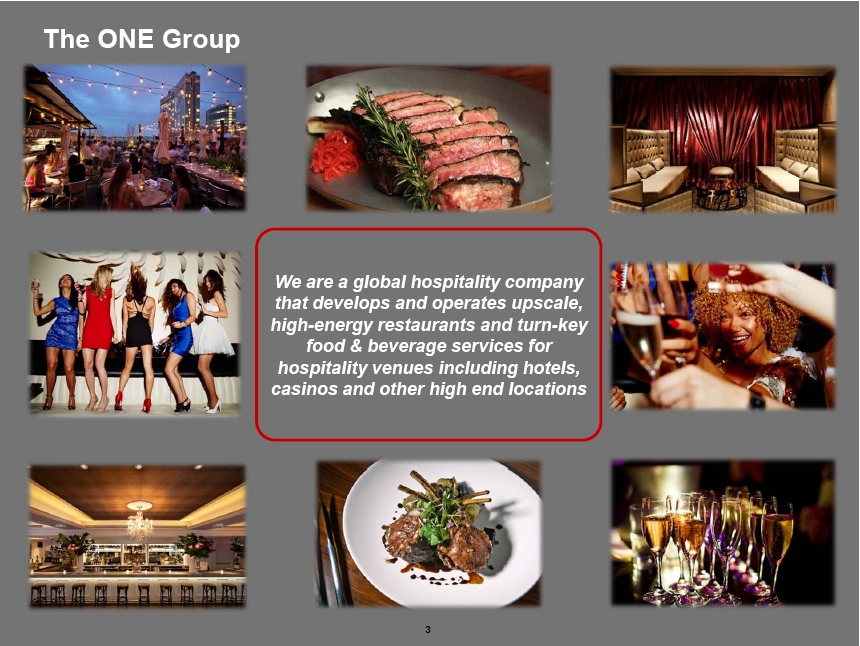
The ONE Group We are a global hospitality company that develops and operates upscale, high-energy restaurants and turn-key food & beverage services for hospitality venues including hotels, casinos and other high end locations
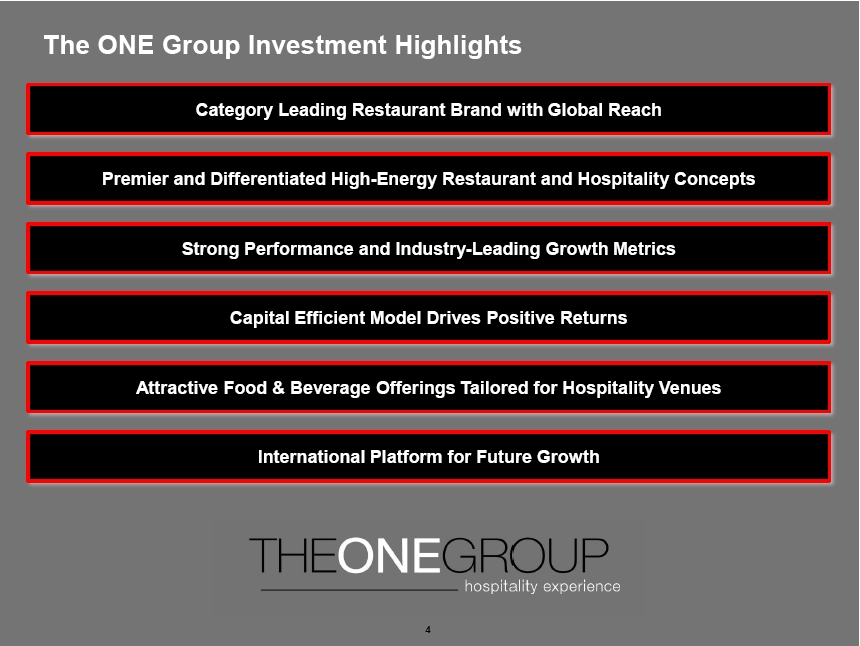
The ONE Group Investment Highlights Category Leading Restaurant Brand with Global Reach Premier and Differentiated High-Energy Restaurant and Hospitality Concepts Strong Performance and Industry-Leading Growth Metrics Capital Efficient Model Drives Positive Returns Attractive Food & Beverage Offerings Tailored for Hospitality Venues International Platform for Future Growth
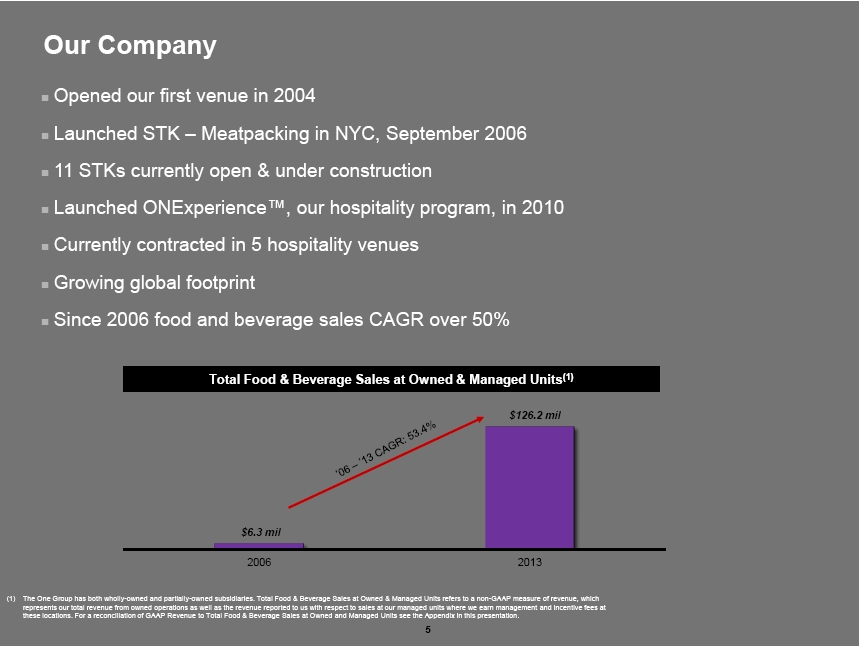
Our Company Opened our first venue in 2004 Launched STK – Meatpacking in NYC, September 2006 11 STKs currently open & under construction Launched ONExperience™, our hospitality program, in 2010 Currently contracted in 5 hospitality venues Growing global footprint Since 2006 food and beverage sales CAGR over 50% Total Food & Beverage Sales at Owned & Managed Units(1) $126.2 mil (1)The One Group has both wholly-owned and partially-owned subsidiaries. Total Food & Beverage Sales at Owned & Managed Units refers to a non-GAAP measure of revenue, which represents our total revenue from owned operations as well as the revenue reported to us with respect to sales at our managed units where we earn management and incentive fees at these locations. For a reconciliation of GAAP Revenue to Total Food & Beverage Sales at Owned and Managed Units see the Appendix in this presentation.
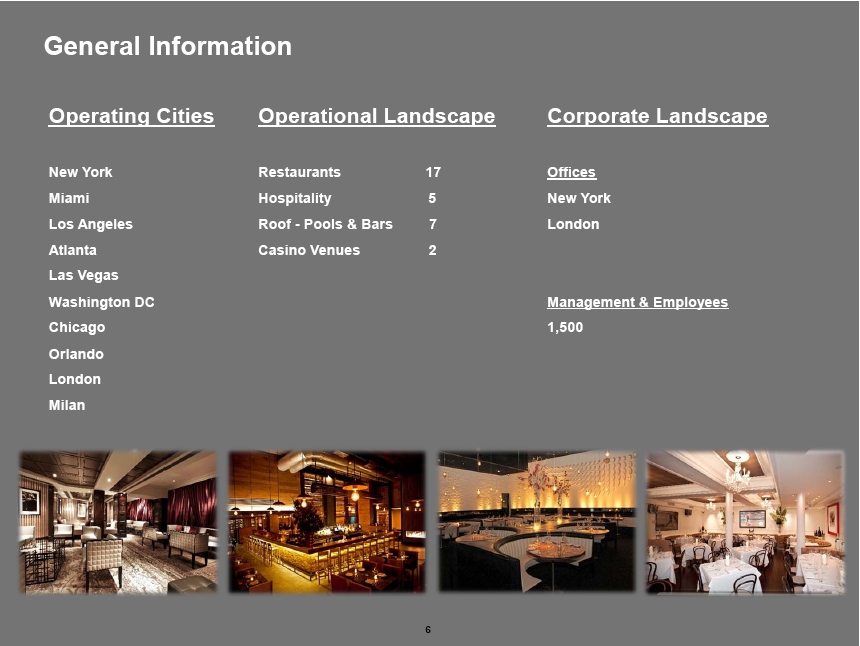
General Information Operating Cities Operational Landscape Corporate Landscape New York Restaurants 17 Offices Miami Hospitality 5 New York Los Angeles Roof - Pools & Bars 7 London Atlanta Casino Venues 2 Las Vegas Washington DC Management & Employees Chicago 1,500 Orlando London Milan


29 Venues Open & Under Construction STK - Restaurants F & B Restaurants Roofs - Pools & Bars Hospitality STK – Atlanta Asellina – NY Radio – London The Perry – S. Beach, FL STK – Los Angeles Cucina Asellina - Atlanta The Rooftop – Miami Gansevoort – Park Ave, NY STK – Las Vegas Cucina Asellina - London Plunge – Midtown NY Hippodrome Casino – UK STK – Miami Bagatelle – New York STK Rooftop – NY ME - London STK – Downtown NY Bagatelle – Los Angeles Marconi - London ME - Milan STK – Midtown NY Heliot Steak – London Lola’s Bar - London STK – London Radio - Milan STK – DC STK – Disney STK - Chicago STK - Milan
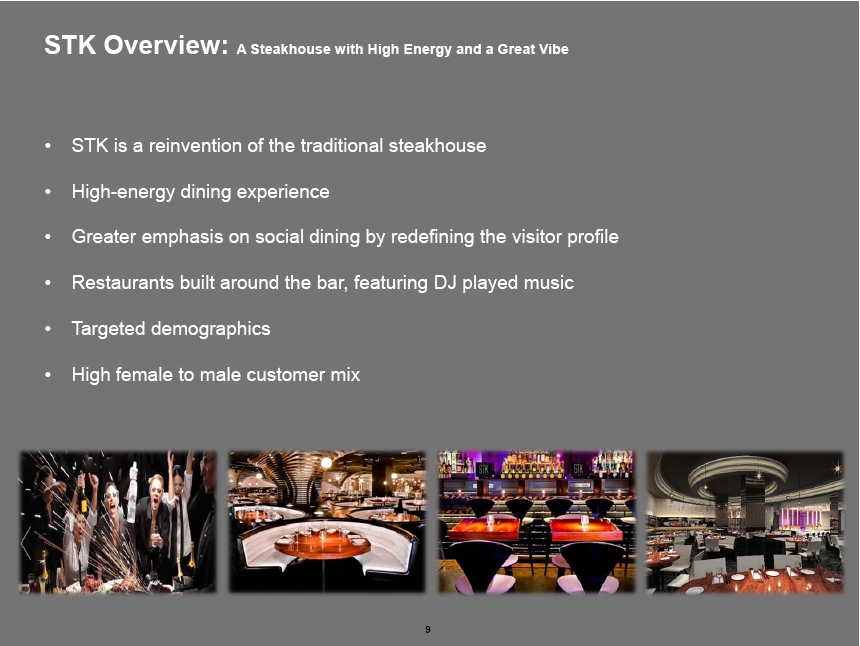
STK Overview: A Steakhouse with High Energy and a Great Vibe STK is a reinvention of the traditional steakhouse High-energy dining experience Greater emphasis on social dining by redefining the visitor profile Restaurants built around the bar, featuring DJ played music Targeted demographics High female to male customer mix
STK Rebel Overview: Rebel is a more accessible STK Maintains the unique features, vibe and energy that have proven so successful for STK Broader menu priced to appeal to a wider market Smaller footprint and lower build- out cost Initially targeting primary cities and then focusing on secondary markets Expect to open first location in 12- 18 months
STK Rebel
STK Rebel
F & B Hospitality Overview: Unique opportunity to leverage restaurant and hospitality expertise Manage F&B for hotels, casinos and hospitality venues Utilize company-branded restaurants or tailored concepts Generate high margin fee income with minimal capital expenditure Enables low risk testing of new concepts Target opportunities generating a minimum of $10M in food & beverage sales ME Hotel - London Gansevoort Park – NYC The Cosmopolitan – LV Hippodrome - London
Turn-Key F & B Solutions for Hospitality Clients (1) Hospitality locations open for a full year include The Cosmopolitan Hotel, Gansevoort Park, ME London, The Hippodrome Casino and The Perry Hotel (temporarily closed in 2013). (2) Total food and beverage sales at managed units represents the revenue reported to us with respect to sales at our managed locations where we earn management and incentive fees at these locations. The sales presented in this table are not included in our GAAP revenues.
A Leading Hospitality Company – ONExperience™ Note: Bagatelle, Gansevoort Park Rooftop, Marconi, Radio M, Asellina, Cucina Asellina and Heliot are jointly-owned and / or licensed brands.
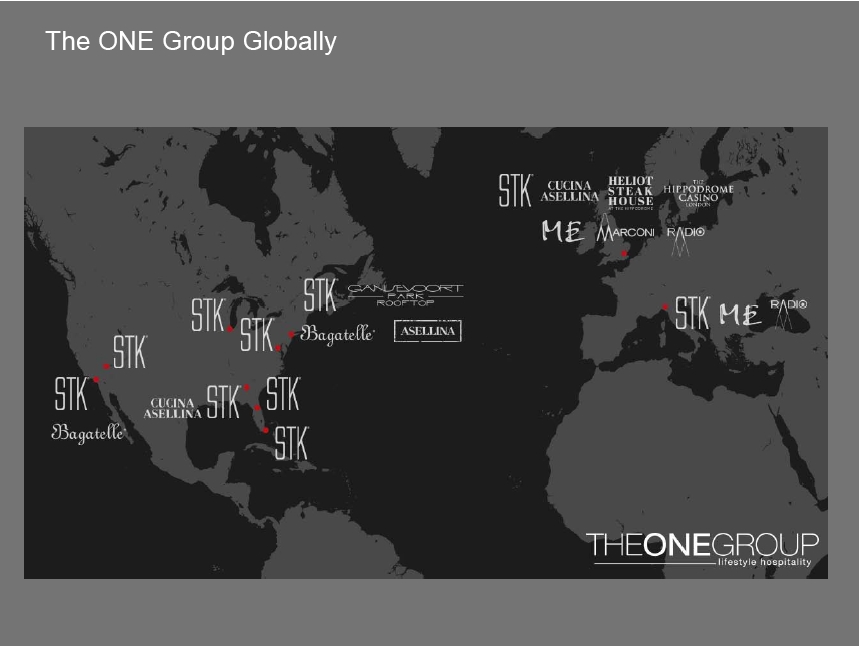
The ONE Group Globally
Expansion Goals Expect to open as many as two to three STKs per year over the next three years 2014 development STK Washington DC opened on April 25 -STK Miami scheduled to reopen in 4Q14 2015 development -STK Disney STK Milan -STK Chicago -ME Milan Hospitality Multiple other development projects in negotiation Launch STK Rebel as a secondary growth vehicle Plan to launch at least one hospitality contract every 12-18 months
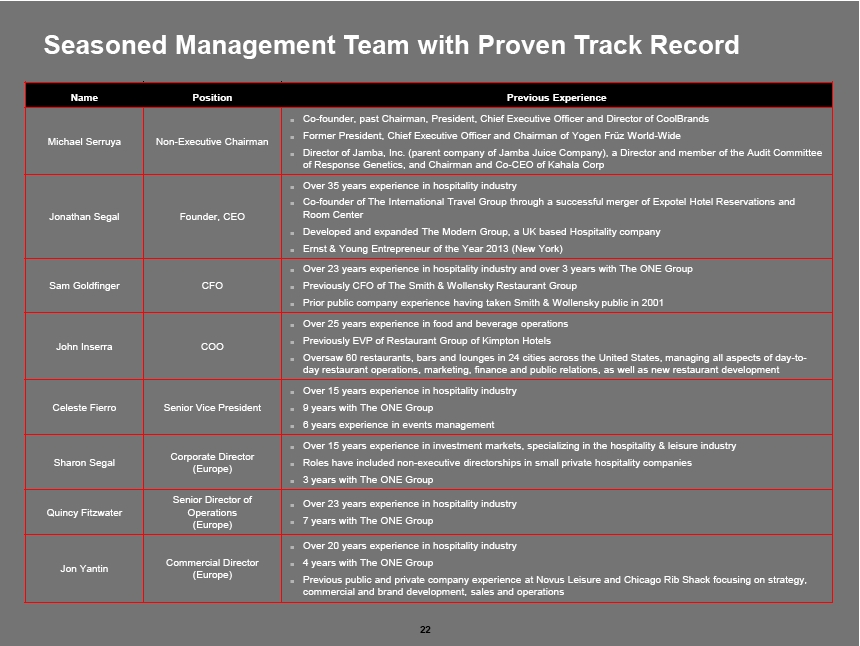
Seasoned Management Team with Proven Track Record Name Position Michael Serruya Non-Executive Chairman Jonathan Segal Founder, CEO Sam Goldfinger CFO John Inserra COO Celeste Fierro Senior Vice President Corporate Director Sharon Segal (Europe) Senior Director of Quincy Fitzwater Operations (Europe) Commercial Director Jon Yantin (Europe) Previous Experience Co-founder, past Chairman, President, Chief Executive Officer and Director of CoolBrands Former President, Chief Executive Officer and Chairman of Yogen Früz World-Wide Director of Jamba, Inc. (parent company of Jamba Juice Company), a Director and member of the Audit Committee of Response Genetics, and Chairman and Co- CEO of Kahala Corp Over 35 years experience in hospitality industry Co-founder of The International Travel Group through a successful merger of Expotel Hotel Reservations and Room Center Developed and expanded The Modern Group, a UK based Hospitality company Ernst & Young Entrepreneur of the Year 2013 (New York) Over 23 years experience in hospitality industry and over 3 years with The ONE Group Previously CFO of The Smith & Wollensky Restaurant Group Prior public company experience having taken Smith & Wollensky public in 2001 Over 25 years experience in food and beverage operations Previously EVP of Restaurant Group of Kimpton Hotels Oversaw 60 restaurants, bars and lounges in 24 cities across the United States, managing all aspects of day- to- day restaurant operations, marketing, finance and public relations, as well as new restaurant development Over 15 years experience in hospitality industry 9 years with The ONE Group 6 years experience in events management Over 15 years experience in investment markets, specializing in the hospitality & leisure industry Roles have included non- executive directorships in small private hospitality companies 3 years with The ONE Group Over 23 years experience in hospitality industry 7 years with The ONE Group Over 20 years experience in hospitality industry 4 years with The ONE Group Previous public and private company experience at Novus Leisure and Chicago Rib Shack focusing on strategy, commercial and brand development, sales and operations


Strong Revenue Performance ($Millions) Total Food & Beverage Sales at Owned & Managed Units (2) (1 ) STK SSS includes all STK restaurants that have been open for 18 months as of that date but excludes STK Miami. (2 ) See footnote 1 on slide 5 for definition of Total Food & Beverage Sales at Owned and Managed Units
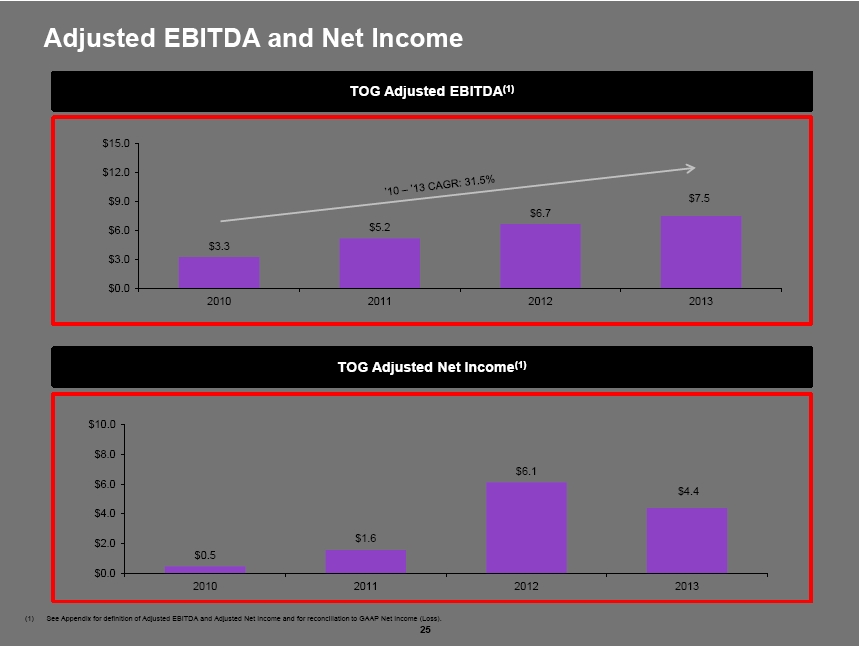
Adjusted EBITDA and Net Income TOG Adjusted EBITDA(1) (1) See Appendix for definition of Adjusted EBITDA and Adjusted Net Income and for reconciliation to GAAP Net Income (Loss).
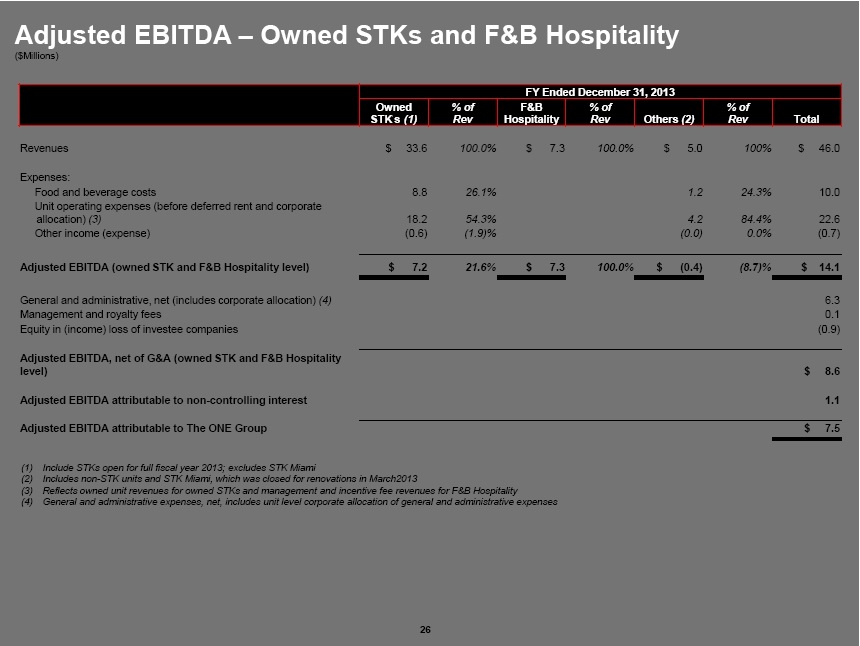
Adjusted EBITDA – Owned STKs and F&B Hospitality ($Millions) FY Ended December 31, 2013 Owned % of F&B % of % of STK’s (1 ) Rev Hospitality Rev Others (2) Rev Total Revenues $ 33.6 100.0 % $ 7.3 100.0 % $ 5.0 100 % $ 46.0 Expenses: Food and beverage costs 8.8 26.1 % 1.2 24.3 % 10.0 Unit operating expenses (before deferred rent and corporate allocation) (3) 18.2 54.3 % 4.2 84.4 % 22.6 Other income (expense) (0.6 ) (1.9 )% (0.0 ) 0.0 % (0.7 ) Adjusted EBITDA (owned STK and F&B Hospitality level) $ 7.2 21.6 % $ 7.3 100.0 % $ (0.4 ) (8.7 )% $ 14.1 General and administrative, net (includes corporate allocation) (4) 6.3 Management and royalty fees 0.1 Equity in (income) loss of investee companies (0.9 ) Adjusted EBITDA, net of G&A (owned STK and F&B Hospitality level) $ 8.6 Adjusted EBITDA attributable to non-controlling interest 1.1 Adjusted EBITDA attributable to The ONE Group $ 7.5 (1) Include STKs open for full fiscal year 2013; excludes STK Miami (2) Includes non- STK units and STK Miami, which was closed for renovations in March2013 (3) Reflects owned unit revenues for owned STKs and management and incentive fee revenues for F&B Hospitality (4) General and administrative expenses, net, includes unit level corporate allocation of general and administrative expenses
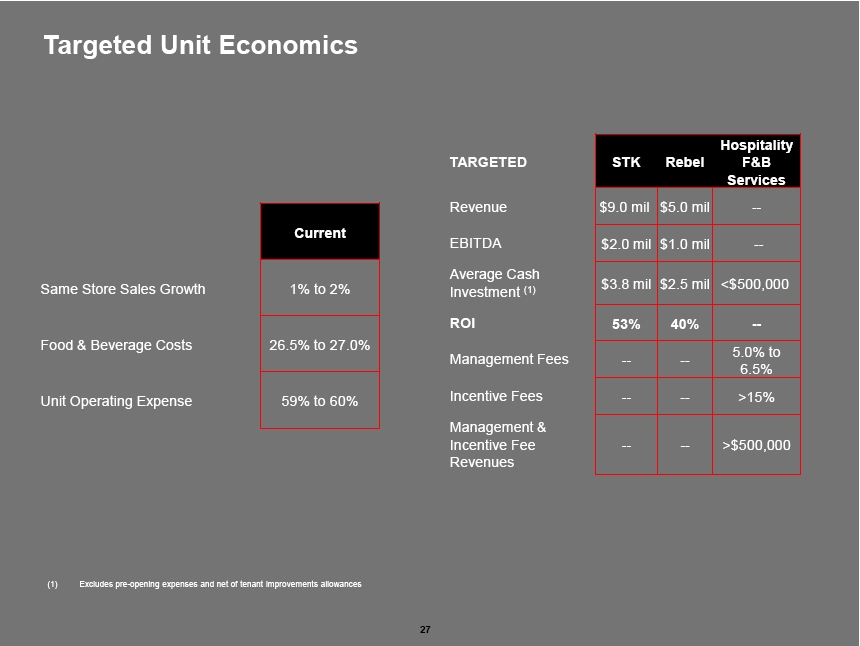
Targeted Unit Economics Hospitality TARGETED STK Rebel F&B Services Revenue $ 9.0 mil $ 5.0 mil -- Current EBITDA $ 2.0 mil $ 1.0 mil -- Average Cash Same Store Sales Growth 1 % to 2 % Investment (1) $ 3.8 mil $ 2.5 mil <$ 500,000 ROI 53 % 40 % -- Food & Beverage Costs 26.5 % to 27.0 % 5.0 % to Management Fees -- -- 6.5 % Unit Operating Expense 59 % to 60 % Incentive Fees -- -- > 15 % Management & Incentive Fee -- -- >$ 500,000 Revenues (1) Excludes pre-opening expenses and net of tenant improvements allowances
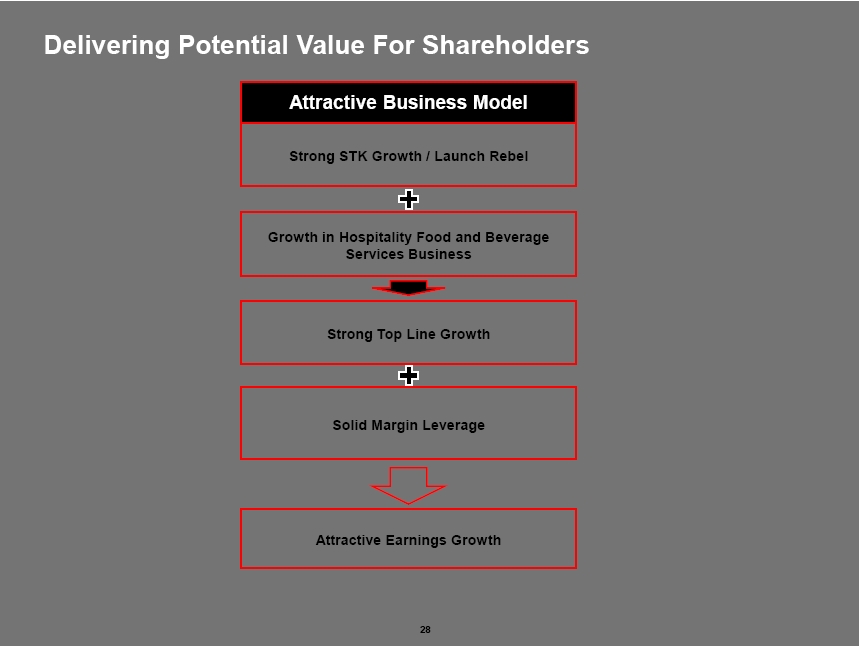
Delivering Potential Value For Shareholders Attractive Business Model Strong STK Growth / Launch Rebel Growth in Hospitality Food and Beverage Services Business Strong Top Line Growth Solid Margin Leverage Attractive Earnings Growth
Historical GAAP Income Statement ($Millions) FYE December 31, 2011 A 2012 A 2013 A Revenues: Owned unit net revenues $ 43.7 $ 56.4 $ 38.6 Management and incentive fee revenue 2.4 3.7 7.3 Total revenue $ 46.1 $ 60.1 $ 46.0 Cost and expenses: Owned operating expenses: Food and beverage costs 10.5 14.3 10.0 Unit operating expenses 26.9 32.6 24.7 General and administrative 1.9 2.2 10.8 Depreciation and amortization 1.7 7.4 1.6 Management and royalty fees 0.4 0.3 0.1 Pre-opening expenses 1.2 0.1 0.8 Transaction costs -- -- 4.6 Equity in (income) loss of investee companies 0.1 0.1 (0.9 ) Derivative expense -- -- 10.1 Interest expense, net of interest income 0.4 0.7 0.8 Other expense (income) 0.1 (4.8 ) (0.7 ) Total costs and expenses $ 43.1 $ 52.9 $ 62.0 Income (loss) from continuing operations before provision for income taxes $ 3.0 $ 7.2 $ (16.0 ) Provision for income taxes 0.2 0.0 0.5 Income (loss) from continuing operations $ 2.8 $ 7.2 $ (16.5 ) Loss from discontinued operations, net of taxes 0.9 10.0 5.4 Net (loss) income $ 1.9 $ (2.8 ) $ (21.9 ) Less: net (loss) attributable to non-controlling interest 0.9 (0.4 ) (0.4 ) Net (loss) income attributable to THE ONE GROUP $ 1.0 $ (2.3 ) $ (21.5 ) Other comprehensive income (loss) Currency translation adjustment 0.0 (0.0 ) 0.1 Comprehensive (loss) income $ 1.0 $ (2.4 ) $ (21.4 )
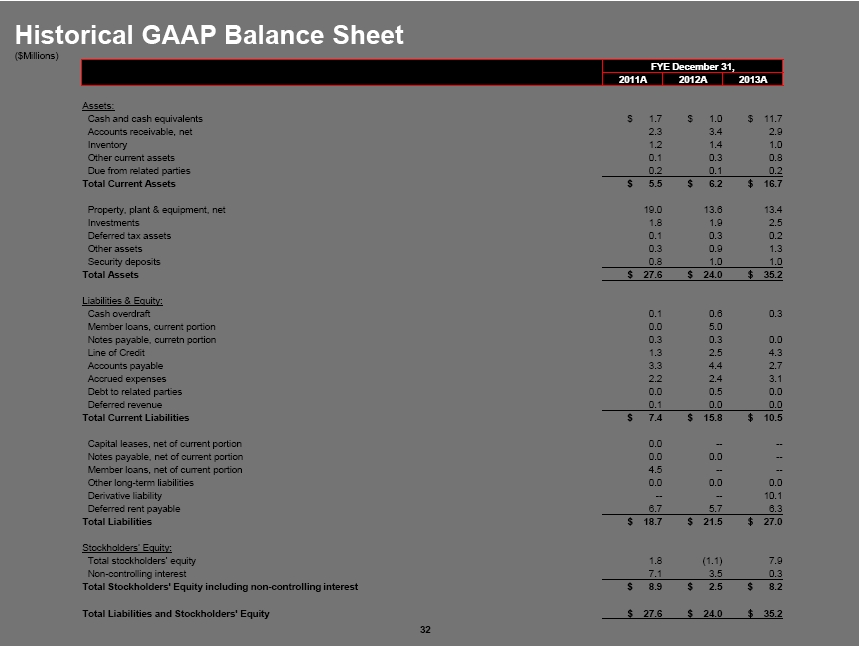
Historical GAAP Balance Sheet ($Millions) FYE December 31, 2011 A 2012 A 2013 A Assets: Cash and cash equivalents $ 1.7 $ 1.0 $ 11.7 Accounts receivable, net 2.3 3.4 2.9 Inventory 1.2 1.4 1.0 Other current assets 0.1 0.3 0.8 Due from related parties 0.2 0.1 0.2 Total Current Assets $ 5.5 $ 6.2 $ 16.7 Property, plant & equipment, net 19.0 13.6 13.4 Investments 1.8 1.9 2.5 Deferred tax assets 0.1 0.3 0.2 Other assets 0.3 0.9 1.3 Security deposits 0.8 1.0 1.0 Total Assets $ 27.6 $ 24.0 $ 35.2 Liabilities & Equity: Cash overdraft 0.1 0.6 0.3 Member loans, current portion 0.0 5.0 Notes payable, curretn portion 0.3 0.3 0.0 Line of Credit 1.3 2.5 4.3 Accounts payable 3.3 4.4 2.7 Accrued expenses 2.2 2.4 3.1 Debt to related parties 0.0 0.5 0.0 Deferred revenue 0.1 0.0 0.0 Total Current Liabilities $ 7.4 $ 15.8 $ 10.5 Capital leases, net of current portion 0.0 -- -- Notes payable, net of current portion 0.0 0.0 -- Member loans, net of current portion 4.5 -- -- Other long-term liabilities 0.0 0.0 0.0 Derivative liability -- -- 10.1 Deferred rent payable 6.7 5.7 6.3 Total Liabilities $ 18.7 $ 21.5 $ 27.0 Stockholders’ Equity: Total stockholders’ equity 1.8 (1.1 ) 7.9 Non-controlling interest 7.1 3.5 0.3 Total Stockholders' Equity including non-controlling interest $ 8.9 $ 2.5 $ 8.2 Total Liabilities and Stockholders' Equity $ 27.6 $ 24.0 $ 35.2
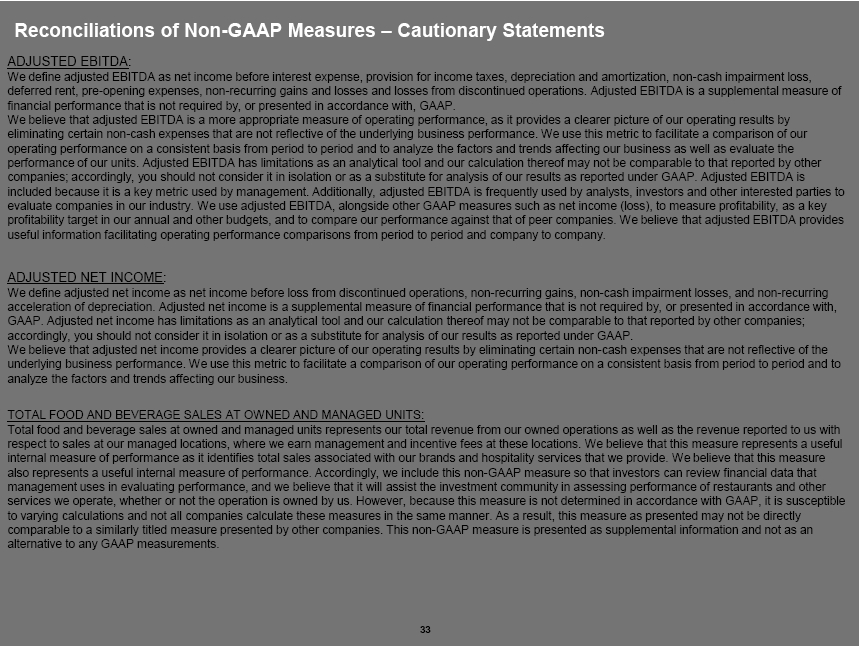
Reconciliations of Non-GAAP Measures – Cautionary Statements ADJUSTED EBITDA: We define adjusted EBITDA as net income before interest expense, provision for income taxes, depreciation and amortization, non-cash impairment loss, deferred rent, pre-opening expenses, non-recurring gains and losses and losses from discontinued operations. Adjusted EBITDA is a supplemental measure of financial performance that is not required by, or presented in accordance with, GAAP. We believe that adjusted EBITDA is a more appropriate measure of operating performance, as it provides a clearer picture of our operating results by eliminating certain non-cash expenses that are not reflective of the underlying business performance. We use this metric to facilitate a comparison of our operating performance on a consistent basis from period to period and to analyze the factors and trends affecting our business as well as evaluate the performance of our units. Adjusted EBITDA has limitations as an analytical tool and our calculation thereof may not be comparable to that reported by other companies; accordingly, you should not consider it in isolation or as a substitute for analysis of our results as reported under GAAP. Adjusted EBITDA is included because it is a key metric used by management. Additionally, adjusted EBITDA is frequently used by analysts, investors and other interested parties to evaluate companies in our industry. We use adjusted EBITDA, alongside other GAAP measures such as net income (loss), to measure profitability, as a key profitability target in our annual and other budgets, and to compare our performance against that of peer companies. We believe that adjusted EBITDA provides useful information facilitating operating performance comparisons from period to period and company to company. ADJUSTED NET INCOME: We define adjusted net income as net income before loss from discontinued operations, non-recurring gains, non-cash impairment losses, and non-recurring acceleration of depreciation. Adjusted net income is a supplemental measure of financial performance that is not required by, or presented in accordance with, GAAP. Adjusted net income has limitations as an analytical tool and our calculation thereof may not be comparable to that reported by other companies; accordingly, you should not consider it in isolation or as a substitute for analysis of our results as reported under GAAP. We believe that adjusted net income provides a clearer picture of our operating results by eliminating certain non-cash expenses that are not reflective of the underlying business performance. We use this metric to facilitate a comparison of our operating performance on a consistent basis from period to period and to analyze the factors and trends affecting our business. TOTAL FOOD AND BEVERAGE SALES AT OWNED AND MANAGED UNITS: Total food and beverage sales at owned and managed units represents our total revenue from our owned operations as well as the revenue reported to us with respect to sales at our managed locations, where we earn management and incentive fees at these locations. We believe that this measure represents a useful internal measure of performance as it identifies total sales associated with our brands and hospitality services that we provide. We believe that this measure also represents a useful internal measure of performance. Accordingly, we include this non-GAAP measure so that investors can review financial data that management uses in evaluating performance, and we believe that it will assist the investment community in assessing performance of restaurants and other services we operate, whether or not the operation is owned by us. However, because this measure is not determined in accordance with GAAP, it is susceptible to varying calculations and not all companies calculate these measures in the same manner. As a result, this measure as presented may not be directly comparable to a similarly titled measure presented by other companies. This non-GAAP measure is presented as supplemental information and not as an alternative to any GAAP measurements.
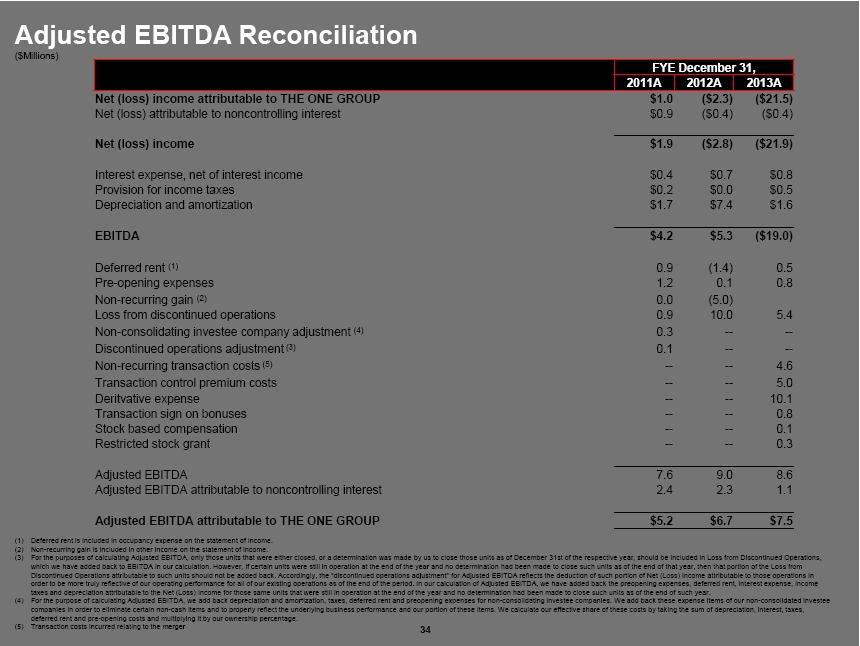
Adjusted EBITDA Reconciliation ($Millions) FYE December 31, 2011 A 2012 A 2013 A Net (loss) income attributable to THE ONE GROUP $ 1.0 ($ 2.3 ) ($ 21.5 ) Net (loss) attributable to noncontrolling interest $ 0.9 ($ 0.4 ) ($ 0.4 ) Net (loss) income $ 1.9 ($ 2.8 ) ($ 21.9 ) Interest expense, net of interest income $ 0.4 $ 0.7 $ 0.8 Provision for income taxes $ 0.2 $ 0.0 $ 0.5 Depreciation and amortization $ 1.7 $ 7.4 $ 1.6 EBITDA $ 4.2 $ 5.3 ($ 19.0 ) Deferred rent (1) 0.9 (1.4 ) 0.5 Pre-opening expenses 1.2 0.1 0.8 Non-recurring gain (2) 0.0 (5.0 ) Loss from discontinued operations 0.9 10.0 5.4 Non-consolidating investee company adjustment (4) 0.3 -- -- Discontinued operations adjustment (3) 0.1 -- -- Non-recurring transaction costs (5) -- -- 4.6 Transaction control premium costs -- -- 5.0 Deritvative expense -- -- 10.1 Transaction sign on bonuses -- -- 0.8 Stock based compensation -- -- 0.1 Restricted stock grant -- -- 0.3 Adjusted EBITDA 7.6 9.0 8.6 Adjusted EBITDA attributable to noncontrolling interest 2.4 2.3 1.1 Adjusted EBITDA attributable to THE ONE GROUP $ 5.2 $ 6.7 $ 7.5 (1) Deferred rent is included in occupancy expense on the statement of income. (2) Non-recurring gain is included in other income on the statement of income. (3) For the purposes of calculating Adjusted EBITDA, only those units that were either closed, or a determination was made by us to close those units as of December 31st of the respective year, should be included in Loss from Discontinued Operations, which we have added back to EBITDA in our calculation. However, if certain units were still in operation at the end of the year and no determination had been made to close such units as of the end of that year, then that portion of the Loss from Discontinued Operations attributable to such units should not be added back. Accordingly, the “discontinued operations adjustment” for Adjusted EBITDA reflects the deduction of such portion of Net (Loss) Income attributable to those operations in order to be more truly reflective of our operating performance for all of our existing operations as of the end of the period. In our calculation of Adjusted EBITDA, we have added back the preopening expenses, deferred rent, interest expense, income taxes and depreciation attributable to the Net (Loss) Income for those same units that were still in operation at the end of the year and no determination had been made to close such units as of the end of such year. (4) For the purpose of calculating Adjusted EBITDA, we add back depreciation and amortization, taxes, deferred rent and preopening expenses for non-consolidating investee companies. We add back these expense items of our non- consolidated investee companies in order to eliminate certain non-cash items and to properly reflect the underlying business performance and our portion of these items. We calculate our effective share of these costs by taking the sum of depreciation, interest, taxes, deferred rent and pre-opening costs and multiplying it by our ownership percentage. (5) Transaction costs incurred relating to the merger
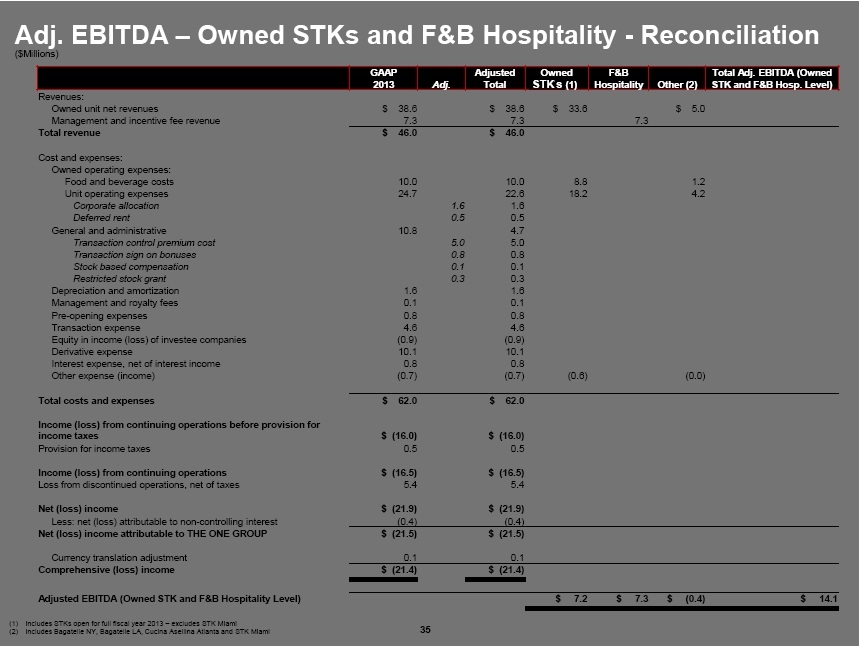
Adj. EBITDA – Owned STKs and F&B Hospitality - Reconciliation ($Millions) GAAP Adjusted Owned F&B Total Adj. EBITDA (Owned 2013 Adj. Total STK’s (1 ) Hospitality Other (2) STK and F&B Hosp. Level) Revenues: Owned unit net revenues $ 38.6 $ 38.6 $ 33.6 $ 5.0 Management and incentive fee revenue 7.3 7.3 7.3 Total revenue $ 46.0 $ 46.0 Cost and expenses: Owned operating expenses: Food and beverage costs 10.0 10.0 8.8 1.2 Unit operating expenses 24.7 22.6 18.2 4.2 Corporate allocation 1.6 1.6 Deferred rent 0.5 0.5 General and administrative 10.8 4.7 Transaction control premium cost 5.0 5.0 Transaction sign on bonuses 0.8 0.8 Stock based compensation 0.1 0.1 Restricted stock grant 0.3 0.3 Depreciation and amortization 1.6 1.6 Management and royalty fees 0.1 0.1 Pre-opening expenses 0.8 0.8 Transaction expense 4.6 4.6 Equity in income (loss) of investee companies (0.9 ) (0.9 ) Derivative expense 10.1 10.1 Interest expense, net of interest income 0.8 0.8 Other expense (income) (0.7 ) (0.7 ) (0.6 ) (0.0 ) Total costs and expenses $ 62.0 $ 62.0 Income (loss) from continuing operations before provision for income taxes $ (16.0 ) $ (16.0 ) Provision for income taxes 0.5 0.5 Income (loss) from continuing operations $ (16.5 ) $ (16.5 ) Loss from discontinued operations, net of taxes 5.4 5.4 Net (loss) income $ (21.9 ) $ (21.9 ) Less: net (loss) attributable to non- controlling interest (0.4 ) (0.4 ) Net (loss) income attributable to THE ONE GROUP $ (21.5 ) $ (21.5 ) Currency translation adjustment 0.1 0.1 Comprehensive (loss) income $ (21.4 ) $ (21.4 ) Adjusted EBITDA (Owned STK and F&B Hospitality Level) $ 7.2 $ 7.3 $ (0.4 ) $ 14.1 (1 ) Includes STKs open for full fiscal year 2013 – excludes STK Miami (2 ) Includes Bagatelle NY, Bagatelle LA, Cucina Asellina Atlanta and STK Miami
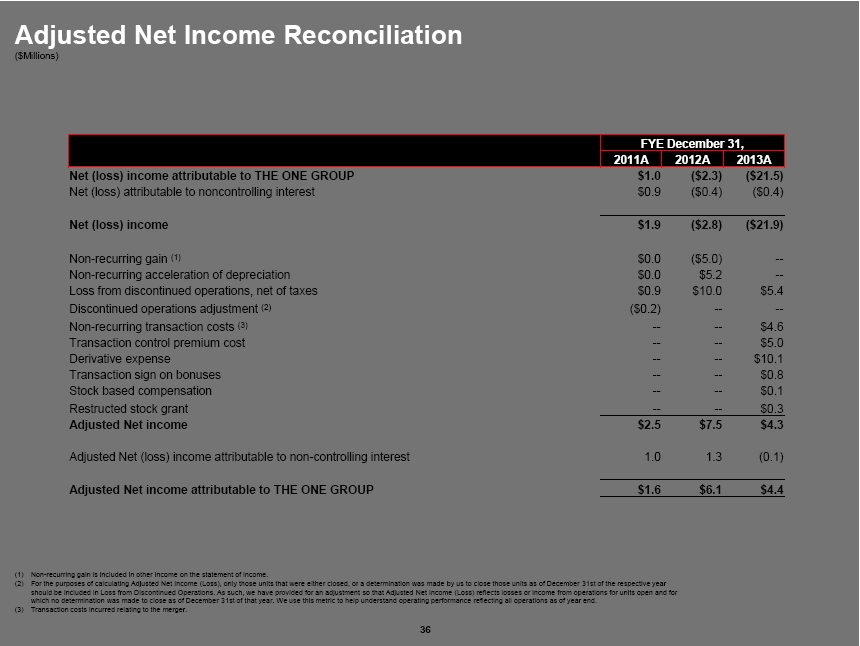
Adjusted Net Income Reconciliation ($Millions) FYE December 31, 2011 A 2012 A 2013 A Net (loss) income attributable to THE ONE GROUP $ 1.0 ($ 2.3 ) ($ 21.5 ) Net (loss) attributable to noncontrolling interest $ 0.9 ($ 0.4 ) ($ 0.4 ) Net (loss) income $ 1.9 ($ 2.8 ) ($ 21.9 ) Non- recurring gain (1) $ 0.0 ($ 5.0 ) -- Non- recurring acceleration of depreciation $ 0.0 $ 5.2 -- Loss from discontinued operations, net of taxes $ 0.9 $ 10.0 $ 5.4 Discontinued operations adjustment (2) ($ 0.2 ) -- -- Non- recurring transaction costs (3) -- -- $ 4.6 Transaction control premium cost -- -- $ 5.0 Derivative expense -- -- $ 10.1 Transaction sign on bonuses -- -- $ 0.8 Stock based compensation -- -- $ 0.1 Restructed stock grant -- -- $ 0.3 Adjusted Net income $ 2.5 $ 7.5 $ 4.3 Adjusted Net (loss) income attributable to non-controlling interest 1.0 1.3 (0.1 ) Adjusted Net income attributable to THE ONE GROUP $ 1.6 $ 6.1 $ 4.4 (1) Non-recurring gain is included in other income on the statement of income. (2) For the purposes of calculating Adjusted Net Income (Loss), only those units that were either closed, or a determination was made by us to close those units as of December 31st of the respective year should be included in Loss from Discontinued Operations. As such, we have provided for an adjustment so that Adjusted Net Income (Loss) reflects losses or income from operations for units open and for which no determination was made to close as of December 31st of that year. We use this metric to help understand operating performance reflecting all operations as of year end. (3) Transaction costs incurred relating to the merger.
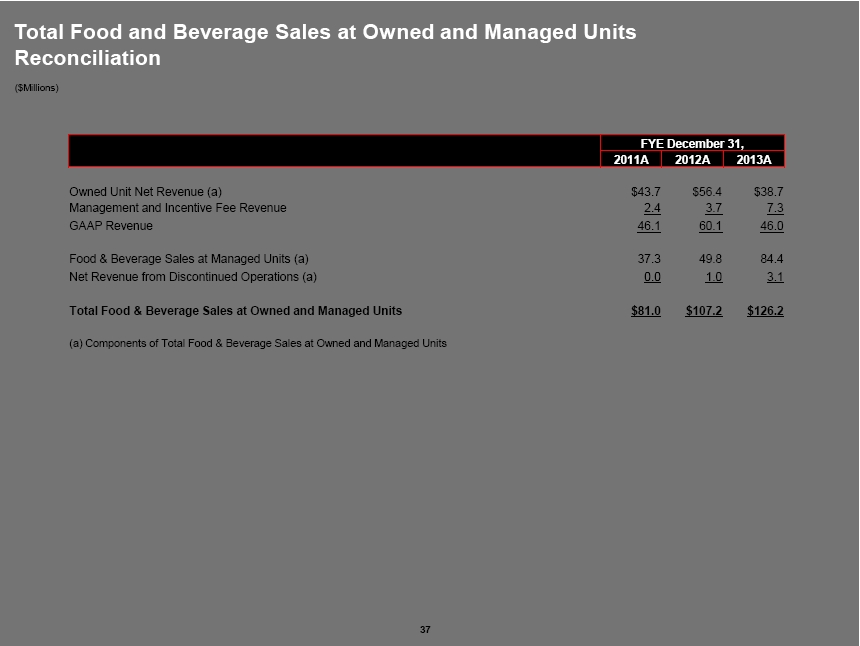
Total Food and Beverage Sales at Owned and Managed Units Reconciliation ($Millions) FYE December 31, 2011 A 2012 A 2013 A Owned Unit Net Revenue (a) $ 43.7 $ 56.4 $ 38.7 Management and Incentive Fee Revenue 2.4 3.7 7.3 GAAP Revenue 46.1 60.1 46.0 Food & Beverage Sales at Managed Units (a) 37.3 49.8 84.4 Net Revenue from Discontinued Operations (a) 0.0 1.0 3.1 Total Food & Beverage Sales at Owned and Managed Units $ 81.0 $ 107.2 $ 126.2 (a) Components of Total Food & Beverage Sales at Owned and Managed Units