
Cautionary Statements 2 Forward - Looking Statements In addition to historical information, this presentation contains statements relating to the Company’s future business and financial performance and future events or developments that may constitute “forward - looking statements” within the meaning of the “safe harbor” provisions of the United States Private Securities Litigation Reform Act of 1995 . These statements are based on current expectations and assumptions that are subject to certain risks and uncertainties . These statements include forward - looking statements with respect to the Company’s business and industry in general . Statements that include the words “expect,” “intend,” “plan,” “believe,” “project,” “forecast,” “estimate,” “may,” “should,” “anticipate” and similar statements of a future or forward - looking nature identify forward - looking statements for purposes of the federal securities laws or otherwise . A variety of factors, many of which are beyond the Company’s control, affect the Company’s operations, performance, business strategies and results and there can be no assurance that the Company’s actual results will not differ materially from those indicated in these statements . These factors include, but are not limited to, continued compliance with governmental regulation, the ability to manage growth, requirements or changes affecting the business in which the Company is engaged, general economic and business conditions and the Company’s ability to open new restaurants and food and beverage locations in current and additional markets . The statements made herein speak only as of the date of this presentation . The Company undertakes no obligation to update its forward - looking statements to reflect events or circumstances after the date of this presentation . Non - GAAP Financial Measures This presentation contains certain non - GAAP financial measures . A “non - GAAP financial measure” is defined as a numerical measure of a company’s financial performance that excludes or includes amounts so as to be different than the most directly comparable measure calculated and presented in accordance with GAAP in the statements of income, balance sheets or statements of cash flow of the Company . These measures are presented because management uses this information to monitor and evaluate financial results and trends and believes this information to also be useful for investors . The ONE Group has both wholly - owned and partially - owned subsidiaries . System - wide revenue refers to a non - GAAP measure of revenue generated by The ONE Group’s operations, regardless of the ownership characteristics of any particular operation . EBITDA is defined as net income before interest expense, provision for income taxes and depreciation and amortization . Adjusted EBITDA and Restaurant Level EBITDA are defined as net income before interest expense, provision for income taxes, depreciation and amortization, pre - opening expenses and adjusted to eliminate the impact of other items set forth in the reconciliations in the appendix, including certain non - cash and/or nonrecurring items as well as items that we do not consider representative of our ongoing operating performance . Pro Forma represents STK Miami as if it had been open for a full year based on 2012 actual results, ME Hotel as if it had been open for a full year based on annualizing the average weekly results during the month of June 2013 and the roll - up of minority investors of STK Miami and STK Midtown . The disclosure of EBITDA and other non - GAAP financial measures may not be comparable to similarly titled measures reported by other companies . EBITDA and Adjusted EBITDA should be considered in addition to, and not as a substitute, or superior to, net income, operating income, cash flows, revenue, or other measured of financial performance prepared in accordance with GAAP .

Today’s Presenters 3 Founder, Chief Executive Officer Chief Financial Officer Non - Executive Chairman

4
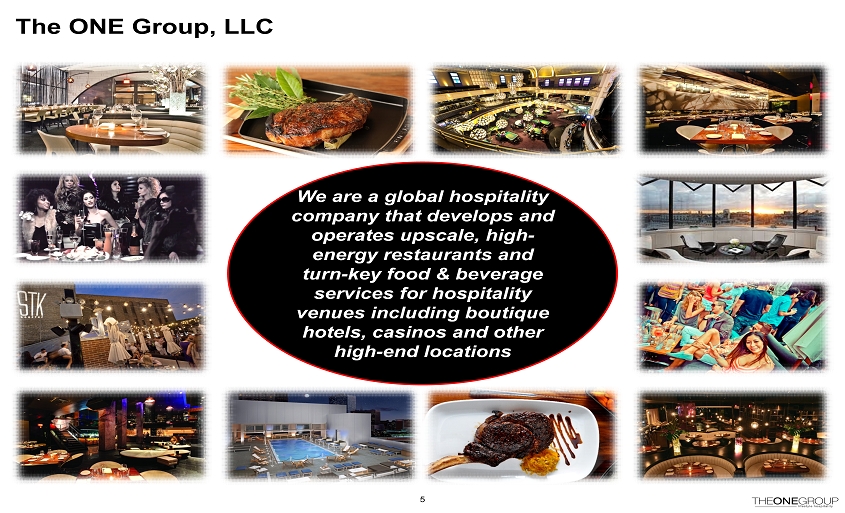
The ONE Group, LLC 5 We are a global hospitality company that develops and operates upscale, high - energy restaurants and turn - key food & beverage services for hospitality venues including boutique hotels, casinos and other high - end locations
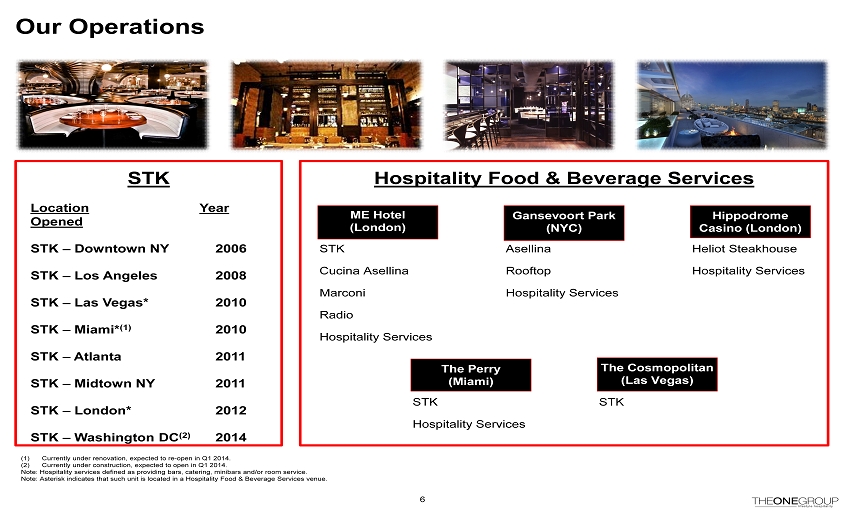
Our Operations 6 (1) Currently under renovation, expected to re - open in Q1 2014. (2) Currently under construction, expected to open in Q1 2014. Note: Hospitality services defined as providing bars, catering, minibars and/or room service. Note: Asterisk indicates that such unit is located in a Hospitality Food & Beverage Services venue. STK Location Year Opened STK – Downtown NY 2006 STK – Los Angeles 2008 STK – Las Vegas* 2010 STK – Miami* (1) 2010 STK – Atlanta 2011 STK – Midtown NY 2011 STK – London* 2012 STK – Washington DC (2) 2014 Hospitality Food & Beverage Services Asellina Rooftop Hospitality Services Gansevoort Park (NYC) STK Cucina Asellina Marconi Radio Hospitality Services ME Hotel (London) STK The Cosmopolitan ( Las Vegas) STK Hospitality Services The Perry (Miami) Heliot Steakhouse Hospitality Services Hippodrome Casino (London)
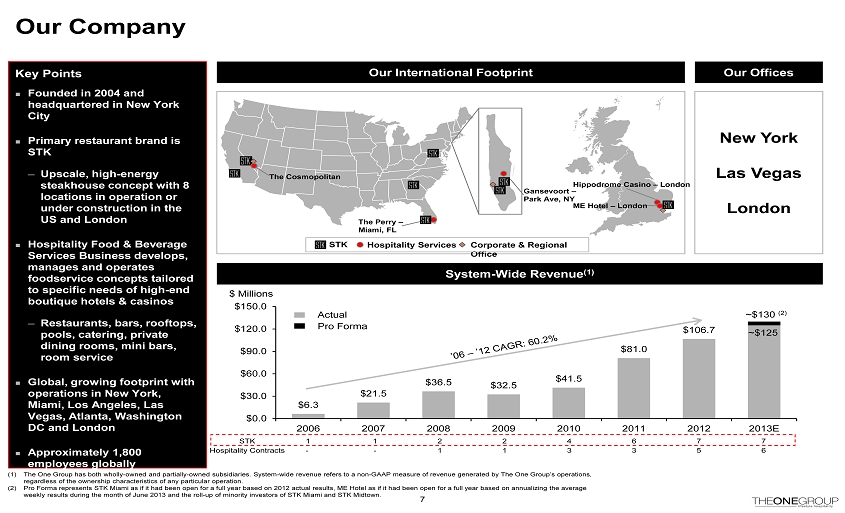
$6.3 $21.5 $36.5 $32.5 $41.5 $81.0 $106.7 $0.0 $30.0 $60.0 $90.0 $120.0 $150.0 2006 2007 2008 2009 2010 2011 2012 2013E Pro Forma Our Company Key Points ¨ Founded in 2004 and headquartered in New York City ¨ Primary restaurant brand is STK ─ Upscale, high - energy steakhouse concept with 8 locations in operation or under construction in the US and London ¨ Hospitality Food & Beverage Services Business develops, manages and operates foodservice concepts tailored to specific needs of high - end boutique hotels & casinos ─ Restaurants, bars, rooftops, pools, catering, private dining rooms, mini bars, room service ¨ Global , growing footprint with operations in New York, Miami, Los Angeles, Las Vegas, Atlanta, Washington DC and London ¨ Approximately 1,800 employees globally Our International Footprint 7 The Perry – Miami, FL Gansevoort – Park Ave, NY Hippodrome Casino – London ME Hotel – London Corporate & Regional Office STK Hospitality Services The Cosmopolitan System - Wide Revenue (1) $ Millions ~$125 ~$130 (2) Actual (1) The One Group has both wholly - owned and partially - owned subsidiaries. System - wide revenue refers to a non - GAAP measure of revenu e generated by The One Group’s operations, regardless of the ownership characteristics of any particular operation. (2) Pro Forma represents STK Miami as if it had been open for a full year based on 2012 actual results, ME Hotel as if it had bee n o pen for a full year based on annualizing the average weekly results during the month of June 2013 and the roll - up of minority investors of STK Miami and STK Midtown. STK 1 1 2 2 4 6 7 7 Hospitality Contracts - - 1 1 3 3 5 6 Our Offices New York Las Vegas London
Investment Highlights 8 Strong Performance and Industry - Leading Growth Metrics STK is a Category Leading Restaurant Brand with Global Reach International Platform for Future Growth Attractive Food & Beverage Offerings Tailored for Hospitality Venues Capital Efficient Model Drives Attractive Returns Premier and Differentiated High - Energy Restaurant and Hospitality Concepts

9
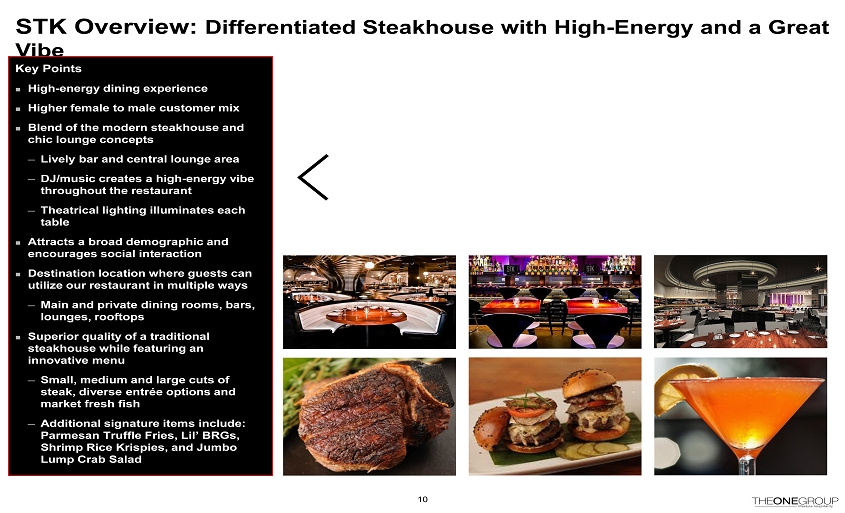
STK Overview: Differentiated Steakhouse with High - Energy and a G reat V ibe Key Points ¨ High - energy dining experience ¨ Higher female to male customer mix ¨ Blend of the modern steakhouse and chic lounge concepts ─ Lively bar and central lounge area ─ DJ/music creates a high - energy vibe throughout the restaurant ─ Theatrical lighting illuminates each table ¨ Attracts a broad demographic and encourages social interaction ¨ Destination location where guests can utilize our restaurant in multiple ways ─ Main and private dining rooms, bars, lounges, rooftops ¨ Superior quality of a traditional steakhouse while featuring an innovative menu ─ Small, medium and large cuts of steak, diverse entrée options and market fresh fish ─ Additional signature items include: Parmesan Truffle Fries, Lil’ BRGs, Shrimp Rice Krispies, and Jumbo Lump Crab Salad 10
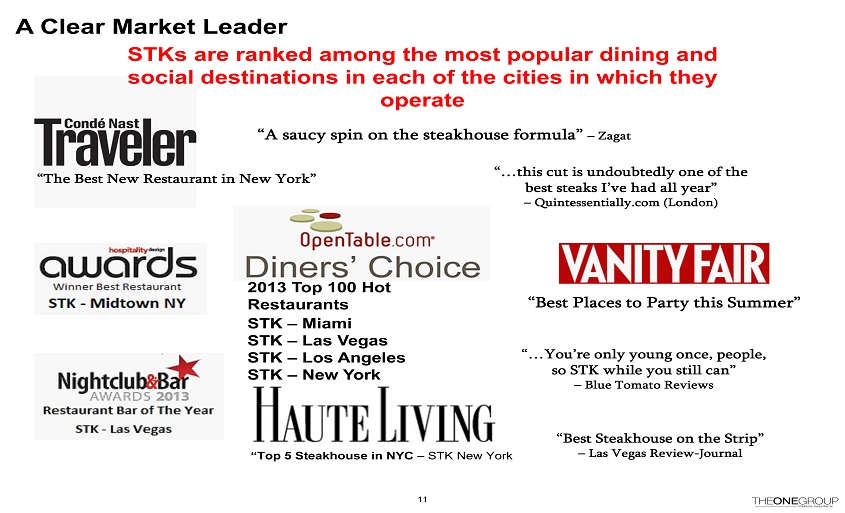
A Clear Market Leader STKs are ranked among the most popular dining and social destinations in each of the cities in which they operate 11 “Best Steakhouse on the Strip” – Las Vegas Review - Journal “Best Places to Party this Summer” “A saucy spin on the steakhouse formula” – Zagat “The Best New Restaurant in New York” “…this cut is undoubtedly one of the best steaks I’ve had all year” – Quintessentially.com (London) “Top 5 Steakhouse in NYC – STK New York “…You’re only young once, people, so STK while you still can” – Blue Tomato Reviews 2013 Top 100 Hot Restaurants STK – Miami STK – Las Vegas STK – Los Angeles STK – New York
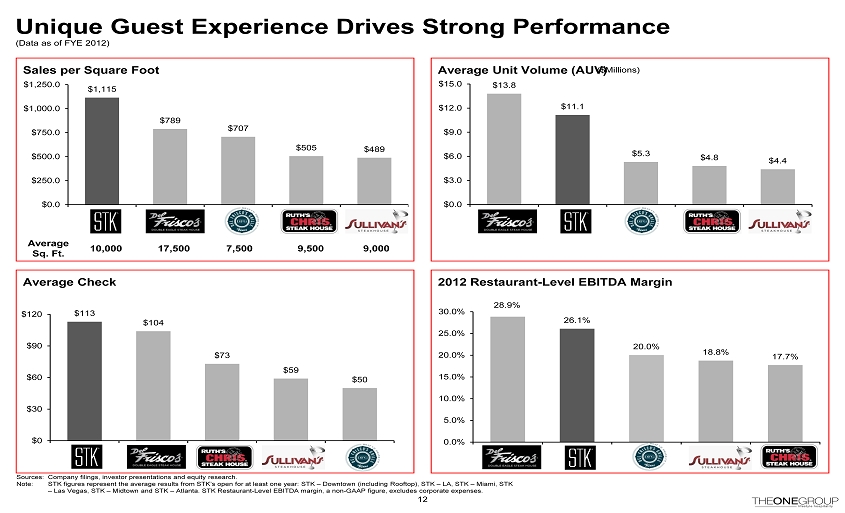
Average Unit Volume (AUV) (Data as of FYE 2012) Sources: Company filings, investor presentations and equity research. Note: STK figures represent the average results from STK’s open for at least one year: STK – Downtown (including Rooftop), STK – LA, STK – Miami, STK – Las Vegas, STK – Midtown and STK – Atlanta. STK Restaurant - Level EBITDA margin, a non - GAAP figure, excludes corporate expenses . Average Check 2012 Restaurant - Level EBITDA Margin $113 $104 $73 $59 $50 $0 $30 $60 $90 $120 12 Unique Guest Experience Drives Strong Performance 28.9% 26.1% 20.0% 18.8% 17.7% 0.0% 5.0% 10.0% 15.0% 20.0% 25.0% 30.0% Sales per Square Foot $1,115 $789 $707 $505 $489 $0.0 $250.0 $500.0 $750.0 $1,000.0 $1,250.0 $13.8 $11.1 $5.3 $4.8 $4.4 $0.0 $3.0 $6.0 $9.0 $12.0 $15.0 ($Millions) Average Sq. Ft. 10,000 17,500 7,500 9,500 9,000
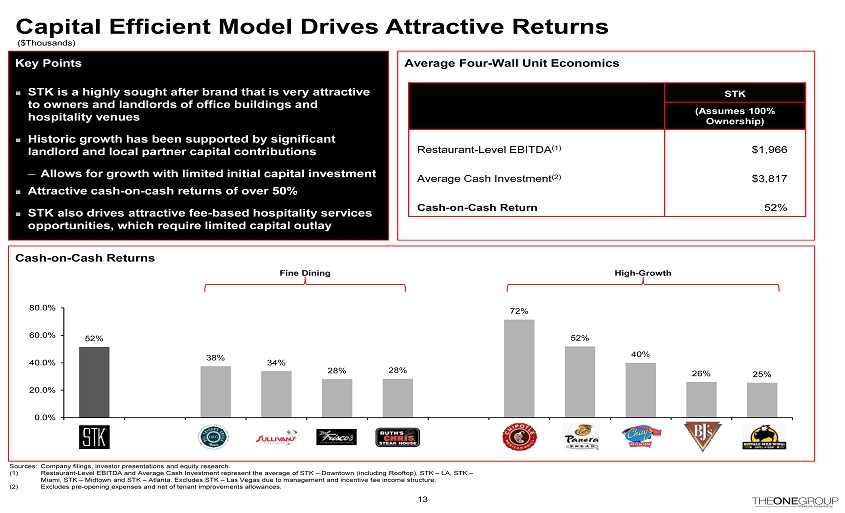
Capital Efficient Model Drives Attractive Returns Cash - on - Cash Returns 52% 38% 34% 28% 28% 72% 52% 40% 26% 25% 0.0% 20.0% 40.0% 60.0% 80.0% Average Four - Wall Unit Economics Sources: Company filings, investor presentations and equity research. (1) Restaurant - Level EBITDA and Average Cash Investment represent the average of STK – Downtown (including Rooftop), STK – LA, STK – Miami, STK – Midtown and STK – Atlanta. Excludes STK – Las Vegas due to management and incentive fee income structure . (2) Excludes pre - opening expenses and net of tenant improvements allowances. High - Growth Fine Dining ($Thousands) 13 Key Points ¨ STK is a highly sought after brand that is very attractive to owners and landlords of office buildings and hospitality venues ¨ Historic growth has been supported by significant landlord and local partner capital contributions ─ Allows for growth with limited initial capital investment ¨ Attractive cash - on - cash returns of over 50% ¨ STK also drives attractive fee - based hospitality services opportunities, which require limited capital outlay STK (Assumes 100% Ownership) Restaurant - Level EBITDA (1) $1,966 (1) Average Cash Investment (2) $3,817 (1) Cash - on - Cash Return 52% (1)

14
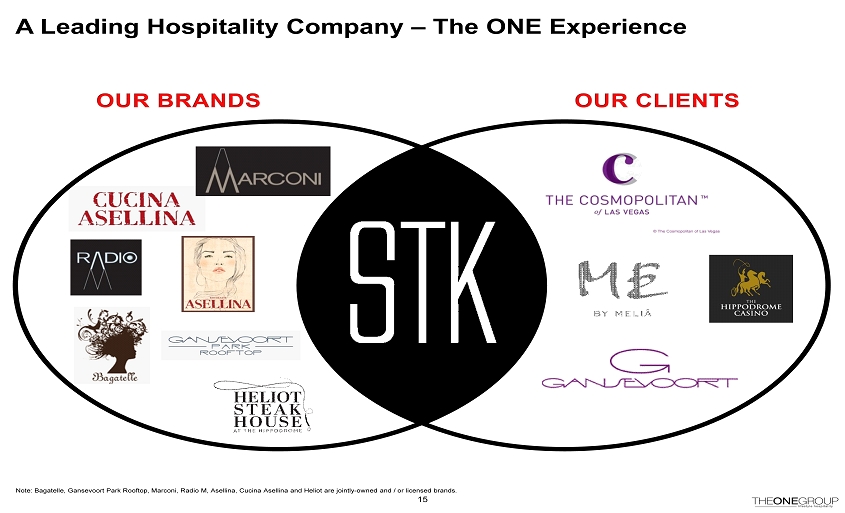
15 A Leading Hospitality Company – The ONE Experience Note: Bagatelle, Gansevoort Park Rooftop, Marconi, Radio M, Asellina, Cucina Asellina and Heliot are jointly - owned and / or lice nsed brands.

Turn - Key F&B Solutions for Hospitality Clients 16 Strong Hospitality System - Wide Revenue Hospitality Locations Open For a Full Year (1) 1 3 3 4 0 1 2 3 4 2010 2011 2012 2013E (1) Hospitality locations open for a full year include The Cosmopolitan Hotel, Gansevoort Park, ME London, The Hippodrome Casino and The Perry Hotel (temporarily closed in 2013). $19.6 $56.3 $57.0 ~$75 $0.0 $30.0 $60.0 $90.0 2010 2011 2012 2013E ($Millions) Cosmopolitan Hotel – LV ME Hotel - London Gansevoort Park – NY Gansevoort Park – NY Hospitality Services Hospitality Services Hospitality Services Cosmopolitan Hotel – LV ME Hotel – London Hospitality Services Palms Casino Resort – LV Hippodrome – London Hospitality Services The Perry – South Beach Restaurant – TBD Hospitality Services
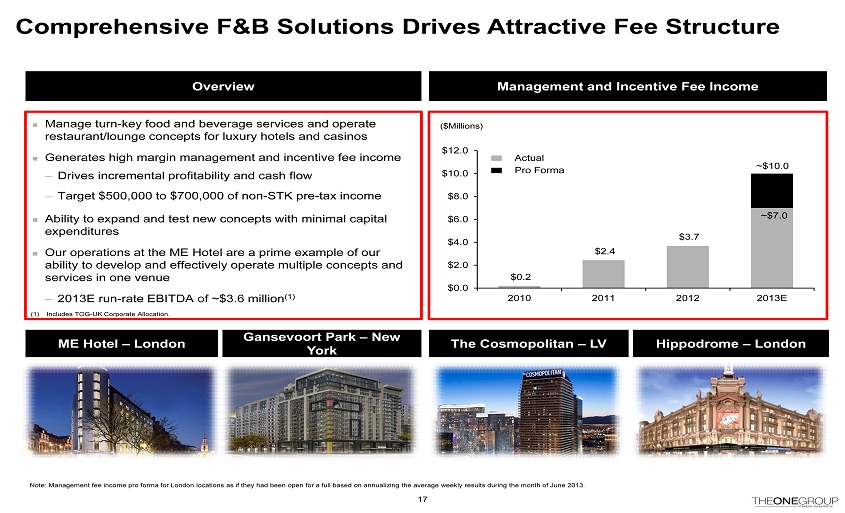
Comprehensive F&B Solutions Drives Attractive Fee Structure ¨ Manage turn - key food and beverage services and operate restaurant/lounge concepts for luxury hotels and casinos ¨ Generates high margin management and incentive fee income ─ Drives incremental profitability and cash flow ─ Target $500,000 to $700,000 of non - STK pre - tax income ¨ Ability to expand and test new concepts with minimal capital expenditures ¨ Our operations at the ME Hotel are a prime example of our ability to develop and effectively operate multiple concepts and services in one venue ─ 2013E run - rate EBITDA of ~$3.6 million (1) Management and Incentive Fee Income ($Millions) ME Hotel – London Gansevoort Park – New York The Cosmopolitan – LV Overview Hippodrome – London 17 $0.2 $2.4 $3.7 $0.0 $2.0 $4.0 $6.0 $8.0 $10.0 $12.0 2010 2011 2012 2013E ~$10.0 ~$7.0 Actual Pro Forma (1) Includes TOG - UK Corporate Allocation. Note: Management fee income pro forma for London locations as if they had been open for a full based on annualizing the average weekly results during the month of June 2013 .

18
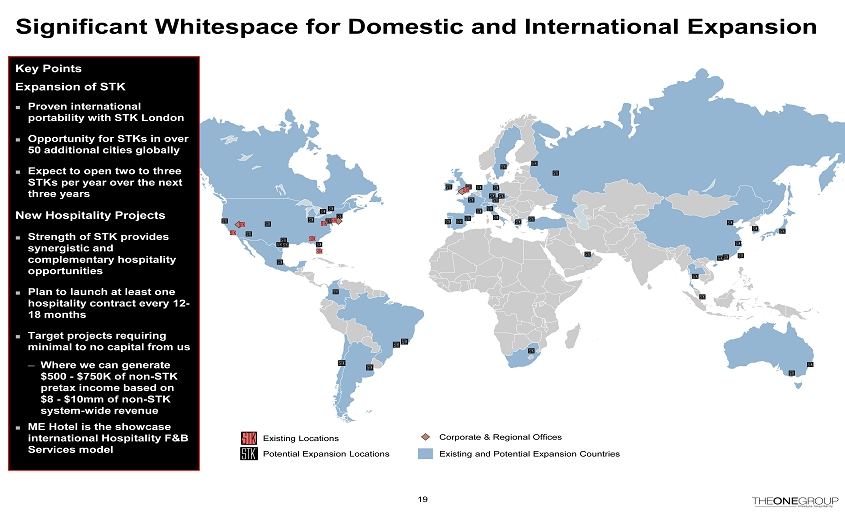
Significant Whitespace for Domestic and International Expansion 19 Existing Locations Potential Expansion Locations Key Points Expansion of STK ¨ Proven international portability with STK London ¨ Opportunity fo r STKs in over 50 additional cities globally ¨ Expect to open two to three STKs per year over the next three years New Hospitality Projects ¨ Strength of STK provides synergistic and complementary hospitality opportunities ¨ Plan to launch at least one hospitality contract every 12 - 18 months ¨ Target projects requiring minimal to no capital from us ─ Where we can generate $500 - $750K of non - STK pretax income based on $8 - $10mm of non - STK system - wide revenue ¨ ME Hotel is the showcase international Hospitality F&B Services model Corporate & Regional Offices Existing and Potential Expansion Countries
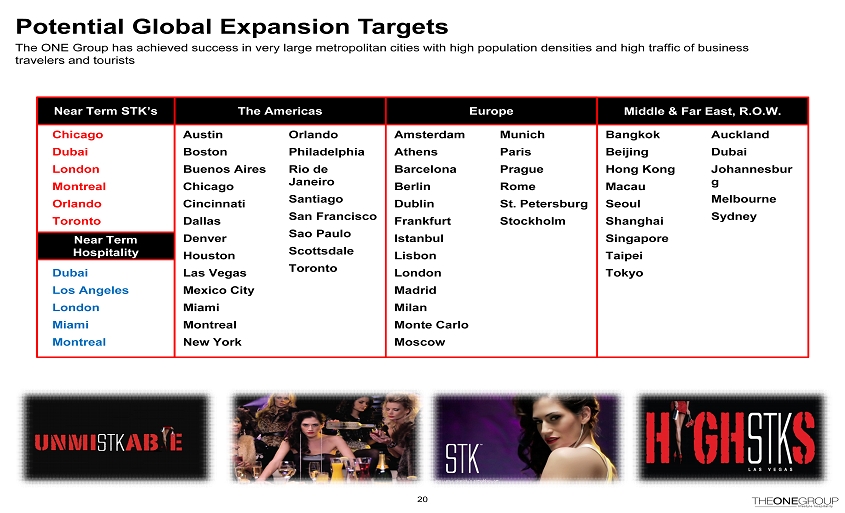
Potential Global Expansion Targets 20 ¨ Near Term STK’s Middle & Far East, R.O.W. Austin Boston Buenos Aires Chicago Cincinnati Dallas Denver Houston Las Vegas Mexico City Miami Montreal New York Amsterdam Athens Barcelona Berlin Dublin Frankfurt Istanbul Lisbon London Madrid Milan Monte Carlo Moscow Bangkok Beijing Hong Kong Macau Seoul Shanghai Singapore Taipei Tokyo The Americas Europe Orlando Philadelphia Rio de Janeiro Santiago San Francisco Sao Paulo Scottsdale Toronto Munich Paris Prague Rome St. Petersburg Stockholm Auckland Dubai Johannesbur g Melbourne Sydney Chicago Dubai London Montreal Orlando Toronto Dubai Los Angeles London Miami Montreal The ONE Group has achieved success in very large metropolitan cities with high population densities and high traffic of busin ess travelers and tourists Near Term Hospitality
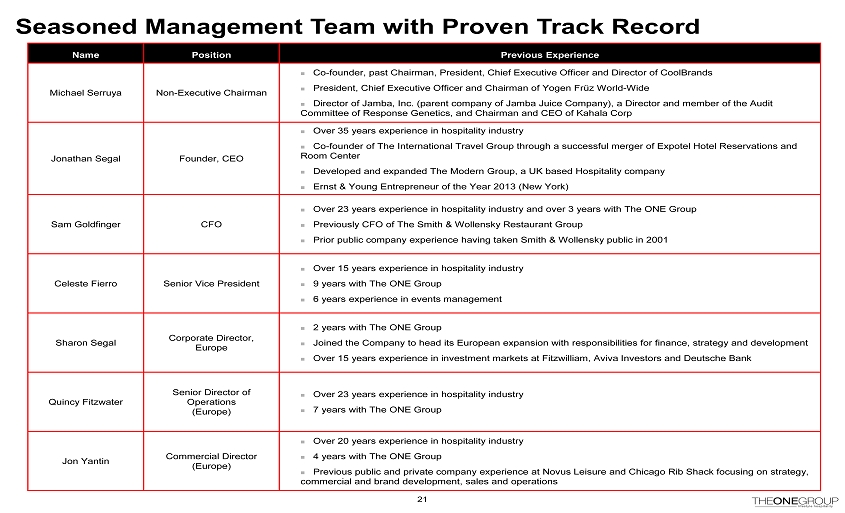
Seasoned Management Team with Proven Track Record Name Position Previous Experience Michael Serruya Non - Executive Chairman ¨ Co - founder, past Chairman, President, Chief Executive Officer and Director of CoolBrands ¨ President, Chief Executive Officer and Chairman of Yogen Früz World - Wide ¨ Director of Jamba, Inc. (parent company of Jamba Juice Company), a Director and member of the Audit Committee of Response Genetics, and Chairman and CEO of Kahala Corp Jonathan Segal Founder, CEO ¨ Over 35 years experience in hospitality industry ¨ Co - founder of The International Travel Group through a successful merger of Expotel Hotel Reservations and Room Center ¨ Developed and expanded The Modern Group, a UK based Hospitality company ¨ Ernst & Young Entrepreneur of the Year 2013 (New York) Sam Goldfinger CFO ¨ Over 23 years experience in hospitality industry and over 3 years with The ONE Group ¨ Previously CFO of The Smith & Wollensky Restaurant Group ¨ Prior public company experience having taken Smith & Wollensky public in 2001 Celeste Fierro Senior Vice President ¨ Over 15 years experience in hospitality industry ¨ 9 years with The ONE Group ¨ 6 years experience in events management Sharon Segal Corporate Director, Europe ¨ 2 years with The ONE Group ¨ Joined the Company to head its European expansion with responsibilities for finance, strategy and development ¨ Over 15 years experience in investment markets at Fitzwilliam, Aviva Investors and Deutsche Bank Quincy Fitzwater Senior Director of Operations (Europe) ¨ Over 23 years experience in hospitality industry ¨ 7 years with The ONE Group Jon Yantin Commercial Director (Europe) ¨ Over 20 years experience in hospitality industry ¨ 4 years with The ONE Group ¨ Previous public and private company experience at Novus Leisure and Chicago Rib Shack focusing on strategy, commercial and brand development, sales and operations 21
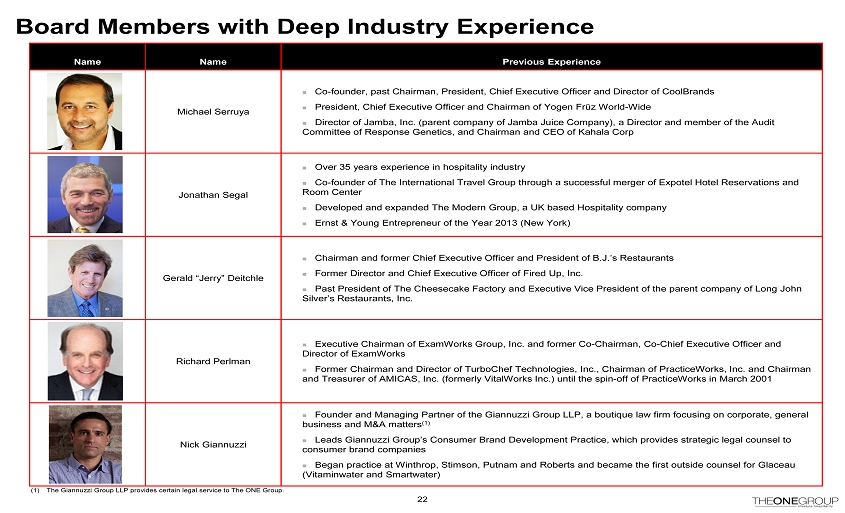
Board Members with Deep Industry Experience Name Name Previous Experience Michael Serruya ¨ Co - founder, past Chairman, President, Chief Executive Officer and Director of CoolBrands ¨ President, Chief Executive Officer and Chairman of Yogen Früz World - Wide ¨ Director of Jamba, Inc. (parent company of Jamba Juice Company), a Director and member of the Audit Committee of Response Genetics, and Chairman and CEO of Kahala Corp Jonathan Segal ¨ Over 35 years experience in hospitality industry ¨ Co - founder of The International Travel Group through a successful merger of Expotel Hotel Reservations and Room Center ¨ Developed and expanded The Modern Group, a UK based Hospitality company ¨ Ernst & Young Entrepreneur of the Year 2013 (New York) Gerald “Jerry” Deitchle ¨ Chairman and former Chief Executive Officer and President of B.J.’s Restaurants ¨ Former Director and Chief Executive Officer of Fired Up, Inc. ¨ Past President of The Cheesecake Factory and Executive Vice President of the parent company of Long John Silver’s Restaurants, Inc. Richard Perlman ¨ Executive Chairman of ExamWorks Group, Inc. and former Co - Chairman, Co - Chief Executive Officer and Director of ExamWorks ¨ Former Chairman and Director of TurboChef Technologies, Inc., Chairman of PracticeWorks, Inc. and Chairman and Treasurer of AMICAS, Inc. (formerly VitalWorks Inc.) until the spin - off of PracticeWorks in March 2001 Nick Giannuzzi ¨ Founder and Managing Partner of the Giannuzzi Group LLP, a boutique law firm focusing on corporate, general business and M&A matters (1) ¨ Leads Giannuzzi Group’s Consumer Brand Development Practice, which provides strategic legal counsel to consumer brand companies ¨ Began practice at Winthrop, Stimson, Putnam and Roberts and became the first outside counsel for Glaceau (Vitaminwater and Smartwater) 22 (1) The Giannuzzi Group LLP provides certain legal service to The ONE Group.

23
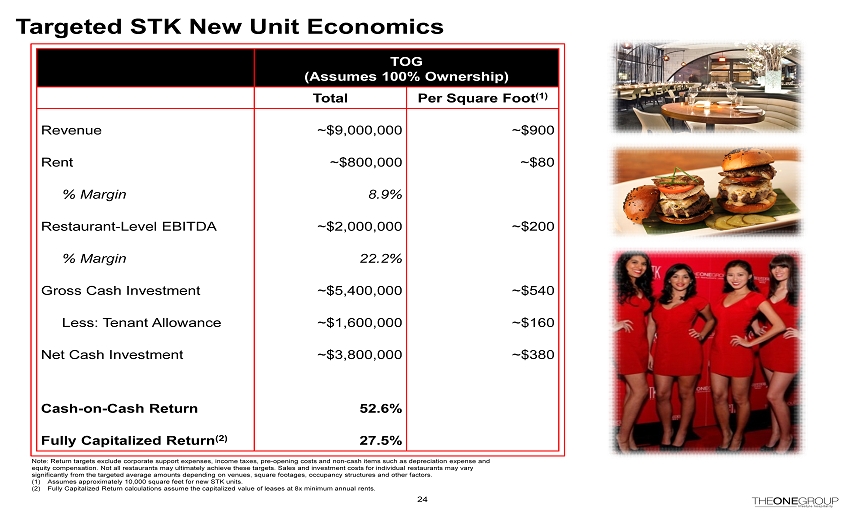
TOG (Assumes 100% Ownership) Total Per Square Foot (1) Revenue ~$9,000,000 ~$900 Rent ~$800,000 ~$80 % Margin 8.9% Restaurant - Level EBITDA ~$2,000,000 ~$200 % Margin 22.2% Gross Cash Investment ~$5,400,000 ~$540 Less: Tenant Allowance ~$1,600,000 ~$160 Net Cash Investment ~$3,800,000 ~$380 Cash - on - Cash Return 52.6% Fully Capitalized Return (2) 27.5% 24 Targeted STK New Unit Economics Note: Return targets exclude corporate support expenses, income taxes, pre - opening costs and non - cash items such as depreciation expense and equity compensation. Not all restaurants may ultimately achieve these targets. Sales and investment costs for individual rest aur ants may vary significantly from the targeted average amounts depending on venues, square footages, occupancy structures and other factors. (1) Assumes approximately 10,000 square feet for new STK units. (2) Fully Capitalized Return calculations assume the capitalized value of leases at 8x minimum annual rents.
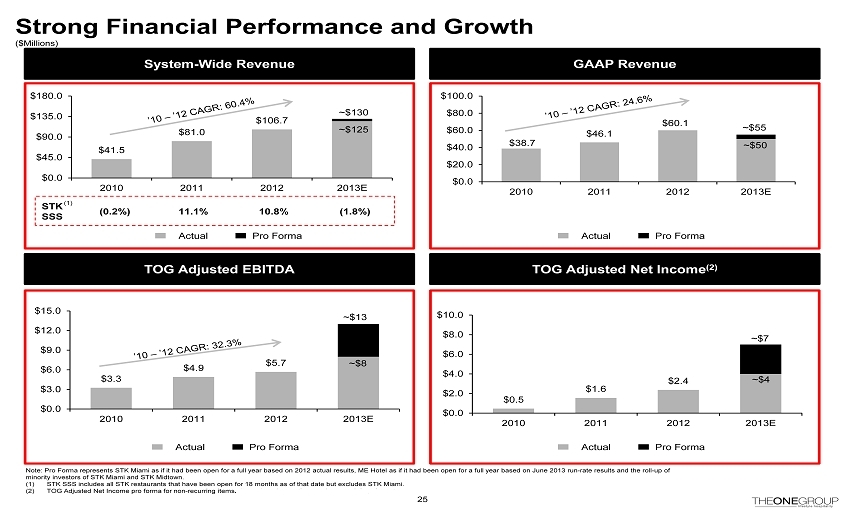
$0.5 $1.6 $2.4 $0.0 $2.0 $4.0 $6.0 $8.0 $10.0 2010 2011 2012 2013E $3.3 $4.9 $5.7 $0.0 $3.0 $6.0 $9.0 $12.0 $15.0 2010 2011 2012 2013E Strong Financial Performance and Growth ($Millions) GAAP Revenue System - Wide Revenue TOG Adjusted Net Income (2) TOG Adjusted EBITDA $41.5 $81.0 $106.7 $0.0 $45.0 $90.0 $135.0 $180.0 2010 2011 2012 2013E 25 $38.7 $46.1 $60.1 $0.0 $20.0 $40.0 $60.0 $80.0 $100.0 2010 2011 2012 2013E Note: Pro Forma represents STK Miami as if it had been open for a full year based on 2012 actual results, ME Hotel as if it had bee n o pen for a full year based on June 2013 run - rate results and the roll - up of minority investors of STK Miami and STK Midtown. (1) STK SSS includes all STK restaurants that have been open for 18 months as of that date but excludes STK Miami. (2) TOG Adjusted Net Income pro forma for non - recurring items, discontinued operations and non - cash impairment. ~$50 ~$55 ~$125 ~$130 ~$7 Actual Pro Forma ~$8 ~$13 ~$4 Actual Pro Forma Actual Pro Forma Actual Pro Forma STK SSS (0.2%) 11.1% 10.8% (1.8%) (1)
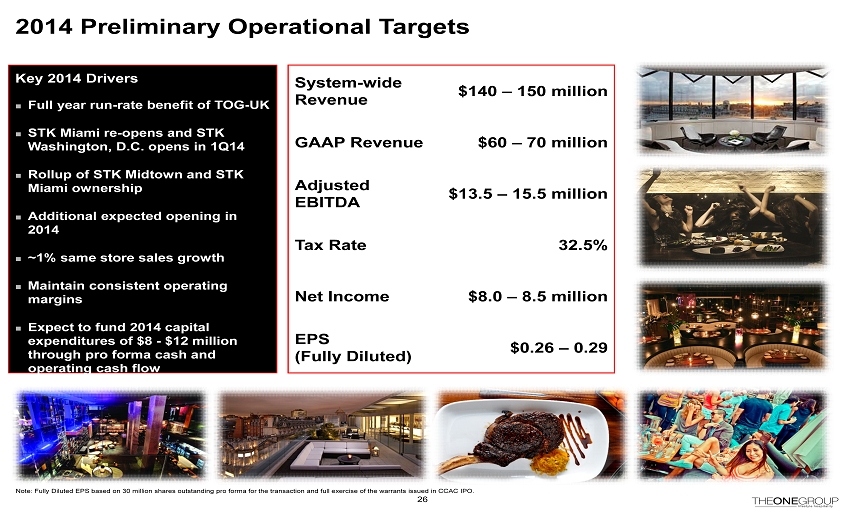
2014 Preliminary Operational Targets 26 System - wide Revenue $140 – 150 million GAAP Revenue $60 – 70 million Adjusted EBITDA $13.5 – 15.5 million Tax Rate 32.5% Net Income $8.0 – 8.5 million EPS (Fully Diluted) $0.26 – 0.29 Key 2014 Drivers ¨ Full year run - rate benefit of TOG - UK ¨ STK Miami re - opens and STK Washington, D.C. opens in 1Q14 ¨ Rollup of STK Midtown and STK Miami ownership ¨ Additional expected opening in 2014 ¨ ~1% same store sales growth ¨ Maintain consistent operating margins ¨ Expect to fund 2014 capital expenditures of $8 - $12 million through pro forma cash and operating cash flow Note: Fully Diluted EPS based on 30 million shares outstanding pro forma for the transaction and full exercise of the warrant s i ssued in CCAC IPO.
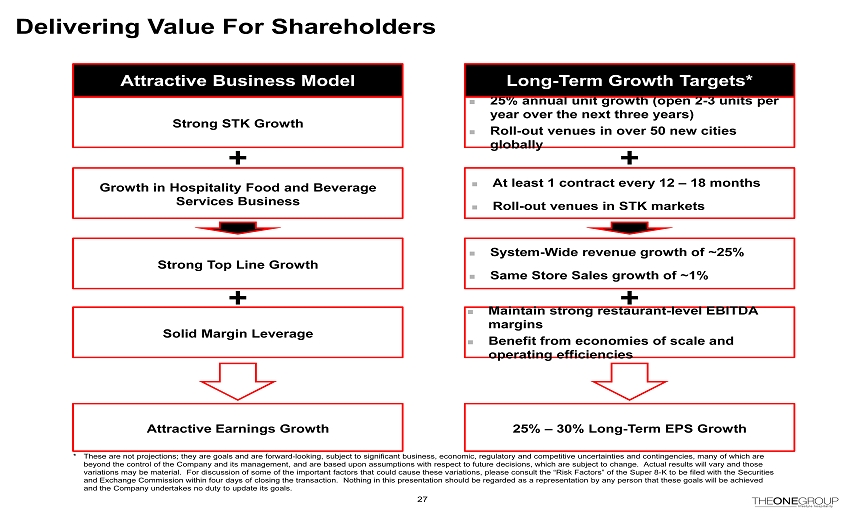
Delivering Value For Shareholders Strong STK Growth Growth in Hospitality Food and Beverage Services Business Solid Margin Leverage 27 Attractive Earnings Growth Attractive Business Model ¨ 25% annual unit growth (open 2 - 3 units per year over the next three years) ¨ Roll - out venues in over 50 new cities globally 25% – 30% Long - Term EPS Growth Long - Term Growth Targets* * These are not projections; they are goals and are forward - looking, subject to significant business, economic, regulatory and competitive uncertainties and contingencies, many of which are beyond the control of the Company and its management, and are based upon assumptions with respect to future decisions, which are subject to change. Actual results will vary and those variations may be material. For discussion of some of the important factors that could cause these variations, please consul t t he “Risk Factors” of the Super 8 - K to be filed with the Securities and Exchange Commission within four days of closing the transaction. Nothing in this presentation should be regarded as a re pre sentation by any person that these goals will be achieved and the Company undertakes no duty to update its goals. ¨ At least 1 contract every 12 – 18 months ¨ Roll - out venues in STK markets ¨ Maintain strong restaurant - level EBITDA margins ¨ Benefit from economies of scale and operating efficiencies Strong Top Line Growth ¨ System - Wide revenue g rowth of ~25% ¨ Same Store Sales growth of ~1%
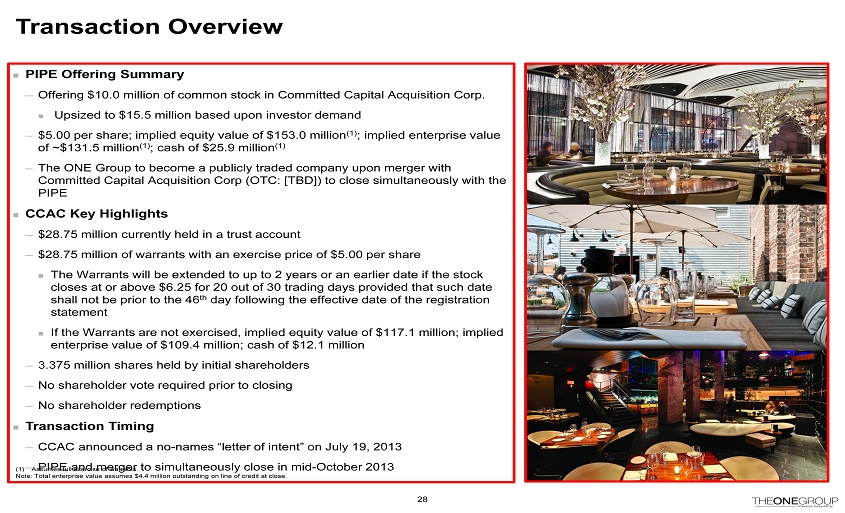
Transaction Overview ¨ PIPE Offering Summary ─ Offering $10.0 million of common stock in Committed Capital Acquisition Corp. ¨ Upsized to $15.5 million based upon investor demand ─ $5.00 per share; implied equity value of $ 153.0 million (1) ; implied enterprise value of ~$131.5 million (1) ; cash of $25.9 million (1) ─ The ONE Group to become a publicly traded company upon merger with Committed Capital Acquisition Corp (OTC: [TBD]) to close simultaneously with the PIPE ¨ CCAC Key Highlights ─ $ 28.75 million currently held in a trust account ─ $ 28.75 million of warrants with an exercise price of $5.00 per share ¨ The Warrants will be extended to up to 2 years or an earlier date if the stock closes at or above $6.25 for 20 out of 30 trading days provided that such date shall not be prior to the 46 th day following the effective date of the registration statement ¨ If the Warrants are not exercised, implied equity value of $117.1 million; implied enterprise value of $109.4 million; cash of $12.1 million ─ 3.375 million shares held by initial shareholders ─ No shareholder vote required prior to closing ─ No shareholder redemptions ¨ Transaction Timing ─ CCAC announced a no - names “letter of intent” on July 19, 2013 ─ PIPE and merger to simultaneously close in mid - October 2013 28 (1) Assumes full exercise of warrants. Note: Total enterprise value assumes $4.4 million outstanding on line of credit at close.
29

30
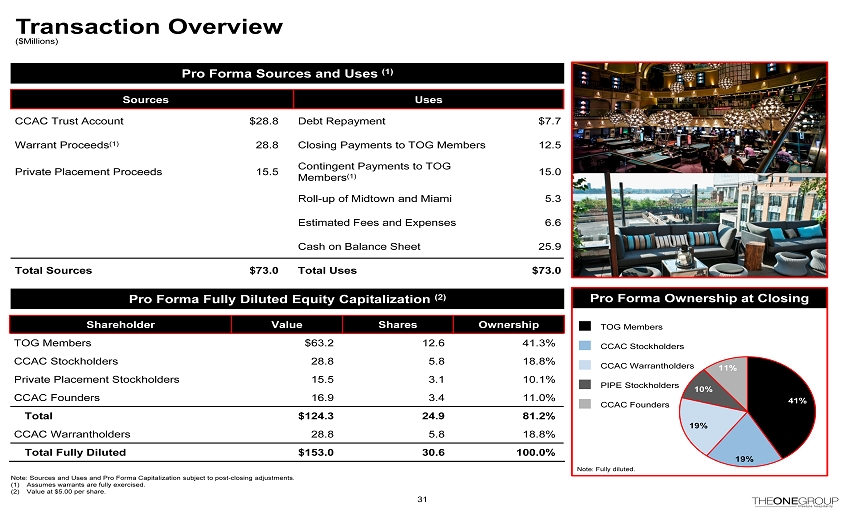
Pro Forma Ownership at Closing Shareholder Value Shares Ownership TOG Members $63.2 12.6 41.3% CCAC Stockholders 28.8 5.8 18.8% Private Placement Stockholders 15.5 3.1 10.1% CCAC Founders 16.9 3.4 11.0% Total $124.3 24.9 81.2% CCAC Warrantholders 28.8 5.8 18.8% Total Fully Diluted $153.0 30.6 100.0% Transaction Overview 31 Pro Forma Fully Diluted Equity Capitalization (2) Pro Forma Sources and Uses (1) Sources Uses CCAC Trust Account $ 28.8 Debt Repayment $7.7 Warrant Proceeds (1) 28.8 Closing Payments to TOG Members 12.5 Private Placement Proceeds 15.5 Contingent Payments to TOG Members (1) 15.0 Roll - up of Midtown and Miami 5.3 Estimated Fees and Expenses 6.6 Cash on Balance Sheet 25.9 Total Sources $73.0 Total Uses $73.0 Note: Sources and Uses and Pro Forma Capitalization subject to post - closing adjustments. (1) Assumes warrants are fully exercised. (2) Value at $5.00 per share. 41% 19% 19% 10% 11% TOG Members CCAC Stockholders CCAC Warrantholders PIPE Stockholders CCAC Founders Note: Fully diluted. ($Millions)
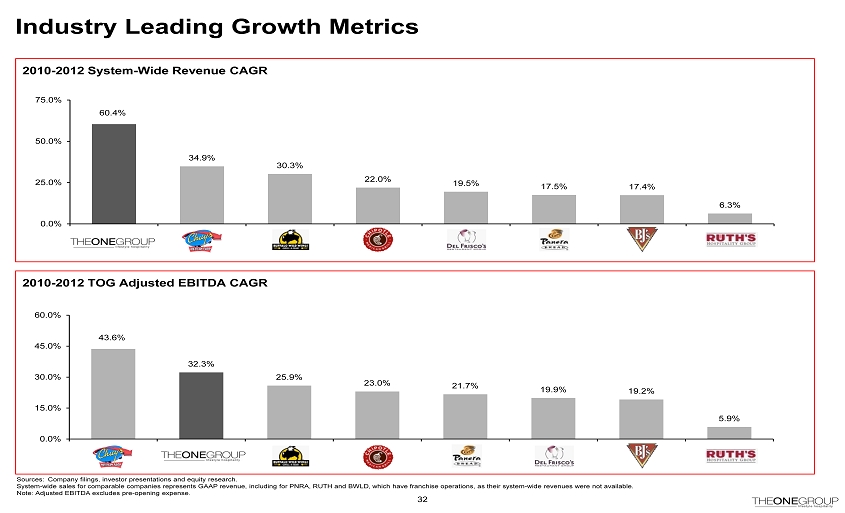
Industry Leading Growth Metrics 2010 - 2012 System - Wide Revenue CAGR 2010 - 2012 TOG Adjusted EBITDA CAGR 43.6% 32.3% 25.9% 23.0% 21.7% 19.9% 19.2% 5.9% 0.0% 15.0% 30.0% 45.0% 60.0% 60.4% 34.9% 30.3% 22.0% 19.5% 17.5% 17.4% 6.3% 0.0% 25.0% 50.0% 75.0% 32 Sources: Company filings, investor presentations and equity research. System - wide sales for comparable companies represents GAAP revenue, including for PNRA, RUTH and BWLD, which have franchise oper ations, as their system - wide revenues were not available. Note: Adjusted EBITDA excludes pre - opening expense.
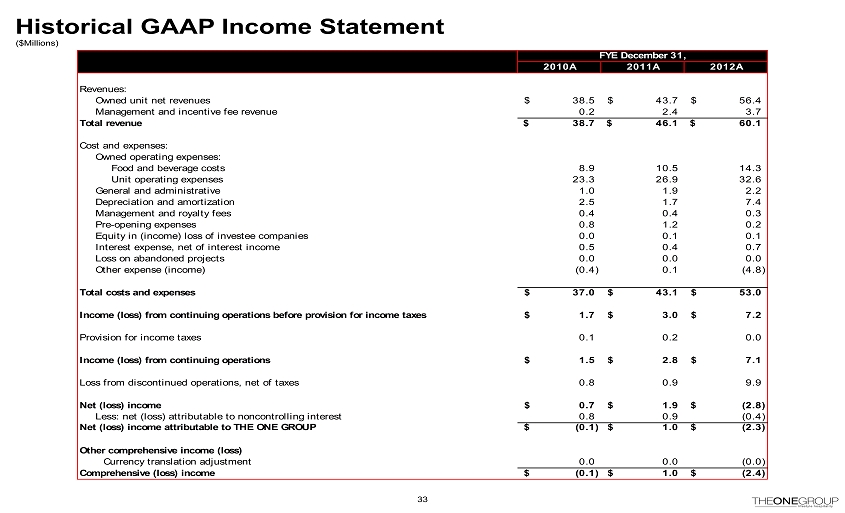
Historical GAAP Income Statement 33 ($ Millions ) FYE December 31, 2010A 2011A 2012A Revenues: Owned unit net revenues 38.5$ 43.7$ 56.4$ Management and incentive fee revenue 0.2 2.4 3.7 Total revenue 38.7$ 46.1$ 60.1$ Cost and expenses: Owned operating expenses: Food and beverage costs 8.9 10.5 14.3 Unit operating expenses 23.3 26.9 32.6 General and administrative 1.0 1.9 2.2 Depreciation and amortization 2.5 1.7 7.4 Management and royalty fees 0.4 0.4 0.3 Pre-opening expenses 0.8 1.2 0.2 Equity in (income) loss of investee companies 0.0 0.1 0.1 Interest expense, net of interest income 0.5 0.4 0.7 Loss on abandoned projects 0.0 0.0 0.0 Other expense (income) (0.4) 0.1 (4.8) Total costs and expenses 37.0$ 43.1$ 53.0$ Income (loss) from continuing operations before provision for income taxes 1.7$ 3.0$ 7.2$ Provision for income taxes 0.1 0.2 0.0 Income (loss) from continuing operations 1.5$ 2.8$ 7.1$ Loss from discontinued operations, net of taxes 0.8 0.9 9.9 Net (loss) income 0.7$ 1.9$ (2.8)$ Less: net (loss) attributable to noncontrolling interest 0.8 0.9 (0.4) Net (loss) income attributable to THE ONE GROUP (0.1)$ 1.0$ (2.3)$ Other comprehensive income (loss) Currency translation adjustment 0.0 0.0 (0.0) Comprehensive (loss) income (0.1)$ 1.0$ (2.4)$
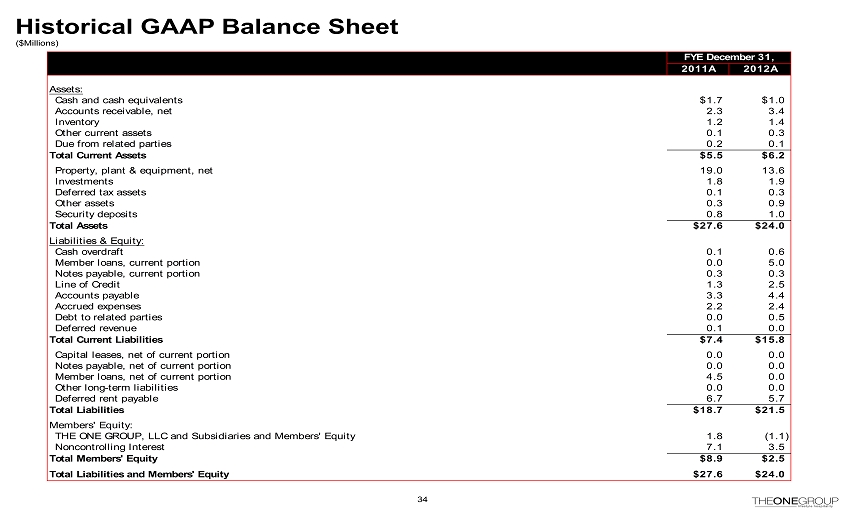
Historical GAAP Balance Sheet ($ Millions ) 34 FYE December 31, 2011A 2012A Assets: Cash and cash equivalents $1.7 $1.0 Accounts receivable, net 2.3 3.4 Inventory 1.2 1.4 Other current assets 0.1 0.3 Due from related parties 0.2 0.1 Total Current Assets $5.5 $6.2 Property, plant & equipment, net 19.0 13.6 Investments 1.8 1.9 Deferred tax assets 0.1 0.3 Other assets 0.3 0.9 Security deposits 0.8 1.0 Total Assets $27.6 $24.0 Liabilities & Equity: Cash overdraft 0.1 0.6 Member loans, current portion 0.0 5.0 Notes payable, current portion 0.3 0.3 Line of Credit 1.3 2.5 Accounts payable 3.3 4.4 Accrued expenses 2.2 2.4 Debt to related parties 0.0 0.5 Deferred revenue 0.1 0.0 Total Current Liabilities $7.4 $15.8 Capital leases, net of current portion 0.0 0.0 Notes payable, net of current portion 0.0 0.0 Member loans, net of current portion 4.5 0.0 Other long-term liabilities 0.0 0.0 Deferred rent payable 6.7 5.7 Total Liabilities $18.7 $21.5 Members' Equity: THE ONE GROUP, LLC and Subsidiaries and Members' Equity 1.8 (1.1) Noncontrolling Interest 7.1 3.5 Total Members' Equity $8.9 $2.5 Total Liabilities and Members' Equity $27.6 $24.0
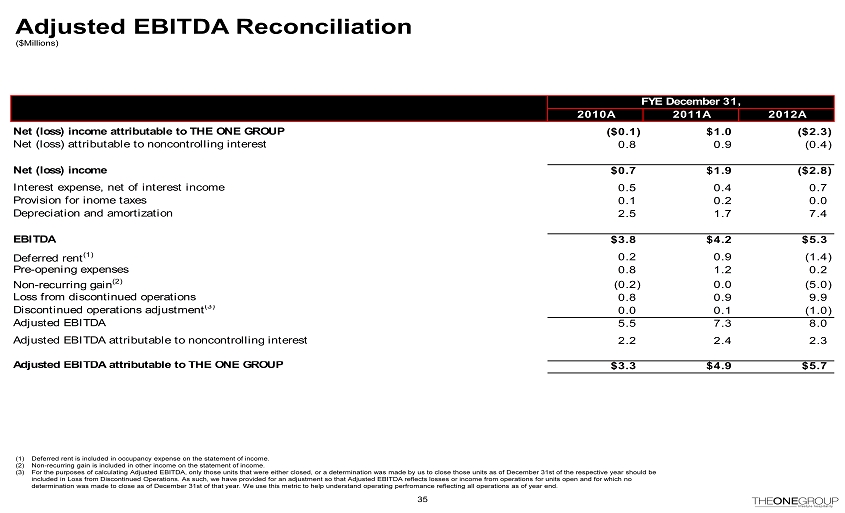
Adjusted EBITDA Reconciliation ($ Millions ) 35 (1) Deferred rent is included in occupancy expense on the statement of income. (2) Non - recurring gain is included in other income on the statement of income. (3) For the purposes of calculating Adjusted EBITDA, only those units that were either closed, or a determination was made by us to close those units as of December 31st of the respective year should be included in Loss from Discontinued Operations. As such, we have provided for an adjustment so that Adjusted EBITDA reflects l oss es or income from operations for units open and for which no determination was made to close as of December 31st of that year. We use this metric to help understand operating perfromance re flecting all operations as of year end. FYE December 31, k 2010A 2011A 2012A Net (loss) income attributable to THE ONE GROUP ($0.1) $1.0 ($2.3) Net (loss) attributable to noncontrolling interest 0.8 0.9 (0.4) Net (loss) income $0.7 $1.9 ($2.8) Interest expense, net of interest income 0.5 0.4 0.7 Provision for inome taxes 0.1 0.2 0.0 Depreciation and amortization 2.5 1.7 7.4 EBITDA $3.8 $4.2 $5.3 Deferred rent (1) 0.2 0.9 (1.4) Pre-opening expenses 0.8 1.2 0.2 Non-recurring gain (2) (0.2) 0.0 (5.0) Loss from discontinued operations 0.8 0.9 9.9 Discontinued operations adjustment (3) 0.0 0.1 (1.0) Adjusted EBITDA 5.5 7.3 8.0 Adjusted EBITDA attributable to noncontrolling interest 2.2 2.4 2.3 Adjusted EBITDA attributable to THE ONE GROUP $3.3 $4.9 $5.7
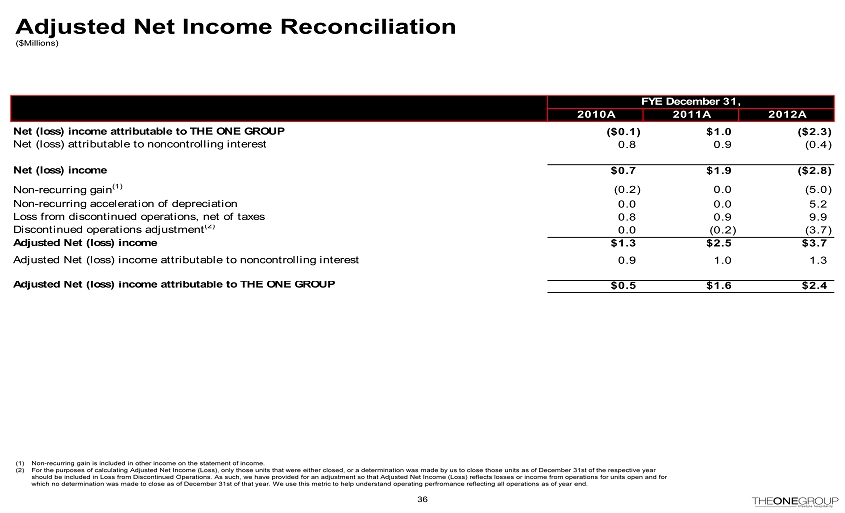
Adjusted Net Income Reconciliation ($ Millions ) 36 (1) Non - recurring gain is included in other income on the statement of income. (2) For the purposes of calculating Adjusted Net Income (Loss), only those units that were either closed, or a determination was mad e by us to close those units as of December 31st of the respective year should be included in Loss from Discontinued Operations. As such, we have provided for an adjustment so that Adjusted Net Inc ome (Loss) reflects losses or income from operations for units open and for which no determination was made to close as of December 31st of that year. We use this metric to help understand operating pe rfr omance reflecting all operations as of year end. FYE December 31, k 2010A 2011A 2012A Net (loss) income attributable to THE ONE GROUP ($0.1) $1.0 ($2.3) Net (loss) attributable to noncontrolling interest 0.8 0.9 (0.4) Net (loss) income $0.7 $1.9 ($2.8) Non-recurring gain (1) (0.2) 0.0 (5.0) Non-recurring acceleration of depreciation 0.0 0.0 5.2 Loss from discontinued operations, net of taxes 0.8 0.9 9.9 Discontinued operations adjustment (2) 0.0 (0.2) (3.7) Adjusted Net (loss) income $1.3 $2.5 $3.7 Adjusted Net (loss) income attributable to noncontrolling interest 0.9 1.0 1.3 Adjusted Net (loss) income attributable to THE ONE GROUP $0.5 $1.6 $2.4